Fusarium sp. AF-4
Taxonomy: cellular organisms; Eukaryota; Opisthokonta; Fungi; Dikarya; Ascomycota; saccharomyceta; Pezizomycotina; leotiomyceta; sordariomyceta; Sordariomycetes; Hypocreomycetidae; Hypocreales; Nectriaceae; Fusarium; Fusarium solani species complex; unclassified Fusarium solani species complex
Average proteome isoelectric point is 6.29
Get precalculated fractions of proteins

Virtual 2D-PAGE plot for 17739 proteins (isoelectric point calculated using IPC2_protein)
Get csv file with sequences according to given criteria:
* You can choose from 21 different methods for calculating isoelectric point
Summary statistics related to proteome-wise predictions


Protein with the lowest isoelectric point:
>tr|A0A428UQT5|A0A428UQT5_9HYPO Translation machinery-associated protein 22 OS=Fusarium sp. AF-4 OX=1325735 GN=CEP52_000197 PE=3 SV=1
MM1 pKa = 7.92RR2 pKa = 11.84FTSVFVAGAFAAMASAATTTVGLSPAQQSQADD34 pKa = 4.07CLEE37 pKa = 4.19ACDD40 pKa = 5.66DD41 pKa = 4.53GDD43 pKa = 4.13VKK45 pKa = 10.97CQSYY49 pKa = 10.31CISVPSPNEE58 pKa = 3.62KK59 pKa = 9.91QVNATTEE66 pKa = 4.2CVANCDD72 pKa = 3.78QGDD75 pKa = 3.83GTEE78 pKa = 4.32AQTEE82 pKa = 4.55KK83 pKa = 11.01YY84 pKa = 9.62AACLQEE90 pKa = 4.61CVSDD94 pKa = 4.38NYY96 pKa = 10.64WKK98 pKa = 9.62TIDD101 pKa = 3.49GTPRR105 pKa = 11.84EE106 pKa = 4.29TSASGSSSDD115 pKa = 4.82DD116 pKa = 4.78DD117 pKa = 4.11EE118 pKa = 7.17DD119 pKa = 4.95KK120 pKa = 11.27DD121 pKa = 4.22SSSKK125 pKa = 11.07ASAKK129 pKa = 9.67ATGTDD134 pKa = 3.35ADD136 pKa = 3.92STAAASASASSDD148 pKa = 3.28SDD150 pKa = 3.77DD151 pKa = 4.88DD152 pKa = 4.76ASEE155 pKa = 4.04TASDD159 pKa = 4.12SEE161 pKa = 4.57ASGTATGTSSSSSSTEE177 pKa = 3.8SGNAAPALVGGVSLLGLFAAVLALL201 pKa = 4.06
MM1 pKa = 7.92RR2 pKa = 11.84FTSVFVAGAFAAMASAATTTVGLSPAQQSQADD34 pKa = 4.07CLEE37 pKa = 4.19ACDD40 pKa = 5.66DD41 pKa = 4.53GDD43 pKa = 4.13VKK45 pKa = 10.97CQSYY49 pKa = 10.31CISVPSPNEE58 pKa = 3.62KK59 pKa = 9.91QVNATTEE66 pKa = 4.2CVANCDD72 pKa = 3.78QGDD75 pKa = 3.83GTEE78 pKa = 4.32AQTEE82 pKa = 4.55KK83 pKa = 11.01YY84 pKa = 9.62AACLQEE90 pKa = 4.61CVSDD94 pKa = 4.38NYY96 pKa = 10.64WKK98 pKa = 9.62TIDD101 pKa = 3.49GTPRR105 pKa = 11.84EE106 pKa = 4.29TSASGSSSDD115 pKa = 4.82DD116 pKa = 4.78DD117 pKa = 4.11EE118 pKa = 7.17DD119 pKa = 4.95KK120 pKa = 11.27DD121 pKa = 4.22SSSKK125 pKa = 11.07ASAKK129 pKa = 9.67ATGTDD134 pKa = 3.35ADD136 pKa = 3.92STAAASASASSDD148 pKa = 3.28SDD150 pKa = 3.77DD151 pKa = 4.88DD152 pKa = 4.76ASEE155 pKa = 4.04TASDD159 pKa = 4.12SEE161 pKa = 4.57ASGTATGTSSSSSSTEE177 pKa = 3.8SGNAAPALVGGVSLLGLFAAVLALL201 pKa = 4.06
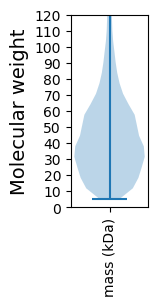
Molecular weight: 19.97 kDa
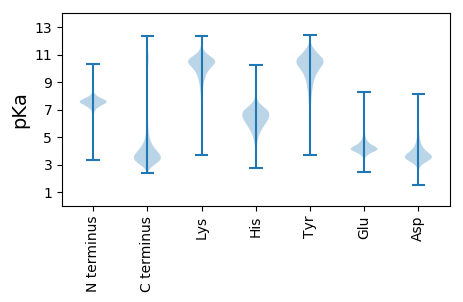
Isoelectric point according different methods:
Protein with the highest isoelectric point:
>tr|A0A428U8J1|A0A428U8J1_9HYPO Uncharacterized protein OS=Fusarium sp. AF-4 OX=1325735 GN=CEP52_003465 PE=4 SV=1
MM1 pKa = 7.86PLTRR5 pKa = 11.84THH7 pKa = 6.67RR8 pKa = 11.84HH9 pKa = 3.83TTPRR13 pKa = 11.84RR14 pKa = 11.84SIFSTRR20 pKa = 11.84RR21 pKa = 11.84RR22 pKa = 11.84APAHH26 pKa = 5.0SHH28 pKa = 5.34HH29 pKa = 6.37TTVTTTTTTRR39 pKa = 11.84KK40 pKa = 8.96PRR42 pKa = 11.84RR43 pKa = 11.84GLLGGGRR50 pKa = 11.84RR51 pKa = 11.84THH53 pKa = 6.23ATPVHH58 pKa = 5.39HH59 pKa = 5.5QQRR62 pKa = 11.84RR63 pKa = 11.84PSMKK67 pKa = 10.24DD68 pKa = 2.95KK69 pKa = 11.41VSGALLKK76 pKa = 11.04LKK78 pKa = 10.68GSLTRR83 pKa = 11.84RR84 pKa = 11.84PGVKK88 pKa = 9.89AAGTRR93 pKa = 11.84RR94 pKa = 11.84MRR96 pKa = 11.84GTDD99 pKa = 2.74GRR101 pKa = 11.84GSHH104 pKa = 5.81RR105 pKa = 11.84RR106 pKa = 11.84ARR108 pKa = 11.84HH109 pKa = 4.06FF110 pKa = 3.77
MM1 pKa = 7.86PLTRR5 pKa = 11.84THH7 pKa = 6.67RR8 pKa = 11.84HH9 pKa = 3.83TTPRR13 pKa = 11.84RR14 pKa = 11.84SIFSTRR20 pKa = 11.84RR21 pKa = 11.84RR22 pKa = 11.84APAHH26 pKa = 5.0SHH28 pKa = 5.34HH29 pKa = 6.37TTVTTTTTTRR39 pKa = 11.84KK40 pKa = 8.96PRR42 pKa = 11.84RR43 pKa = 11.84GLLGGGRR50 pKa = 11.84RR51 pKa = 11.84THH53 pKa = 6.23ATPVHH58 pKa = 5.39HH59 pKa = 5.5QQRR62 pKa = 11.84RR63 pKa = 11.84PSMKK67 pKa = 10.24DD68 pKa = 2.95KK69 pKa = 11.41VSGALLKK76 pKa = 11.04LKK78 pKa = 10.68GSLTRR83 pKa = 11.84RR84 pKa = 11.84PGVKK88 pKa = 9.89AAGTRR93 pKa = 11.84RR94 pKa = 11.84MRR96 pKa = 11.84GTDD99 pKa = 2.74GRR101 pKa = 11.84GSHH104 pKa = 5.81RR105 pKa = 11.84RR106 pKa = 11.84ARR108 pKa = 11.84HH109 pKa = 4.06FF110 pKa = 3.77
Molecular weight: 12.46 kDa
Isoelectric point according different methods:
Peptides (in silico digests for buttom-up proteomics)
Below you can find in silico digests of the whole proteome with Trypsin, Chymotrypsin, Trypsin+LysC, LysN, ArgC proteases suitable for different mass spec machines.| Try ESI |
 |
|---|
| ChTry ESI |
 |
|---|
| ArgC ESI |
 |
|---|
| LysN ESI |
 |
|---|
| TryLysC ESI |
 |
|---|
| Try MALDI |
 |
|---|
| ChTry MALDI |
 |
|---|
| ArgC MALDI |
 |
|---|
| LysN MALDI |
 |
|---|
| TryLysC MALDI |
 |
|---|
| Try LTQ |
 |
|---|
| ChTry LTQ |
 |
|---|
| ArgC LTQ |
 |
|---|
| LysN LTQ |
 |
|---|
| TryLysC LTQ |
 |
|---|
| Try MSlow |
 |
|---|
| ChTry MSlow |
 |
|---|
| ArgC MSlow |
 |
|---|
| LysN MSlow |
 |
|---|
| TryLysC MSlow |
 |
|---|
| Try MShigh |
 |
|---|
| ChTry MShigh |
 |
|---|
| ArgC MShigh |
 |
|---|
| LysN MShigh |
 |
|---|
| TryLysC MShigh |
 |
|---|
General Statistics
Number of major isoforms |
Number of additional isoforms |
Number of all proteins |
Number of amino acids |
Min. Seq. Length |
Max. Seq. Length |
Avg. Seq. Length |
Avg. Mol. Weight |
|---|---|---|---|---|---|---|---|
0 |
7717122 |
50 |
5953 |
435.0 |
48.24 |
Amino acid frequency
Ala |
Cys |
Asp |
Glu |
Phe |
Gly |
His |
Ile |
Lys |
Leu |
|---|---|---|---|---|---|---|---|---|---|
8.447 ± 0.02 | 1.336 ± 0.007 |
5.9 ± 0.014 | 6.263 ± 0.02 |
3.817 ± 0.012 | 6.901 ± 0.021 |
2.394 ± 0.008 | 5.003 ± 0.013 |
4.81 ± 0.019 | 8.989 ± 0.023 |
Met |
Asn |
Gln |
Pro |
Arg |
Ser |
Thr |
Val |
Trp |
Tyr |
|---|---|---|---|---|---|---|---|---|---|
2.245 ± 0.007 | 3.584 ± 0.009 |
5.975 ± 0.021 | 3.929 ± 0.013 |
5.976 ± 0.017 | 7.92 ± 0.022 |
5.95 ± 0.023 | 6.189 ± 0.011 |
1.612 ± 0.008 | 2.759 ± 0.01 |
Most of the basic statistics you can see at this page can be downloaded from this CSV file
Proteome-pI is available under Creative Commons Attribution-NoDerivs license, for more details see here
| Reference: Kozlowski LP. Proteome-pI 2.0: Proteome Isoelectric Point Database Update. Nucleic Acids Res. 2021, doi: 10.1093/nar/gkab944 | Contact: Lukasz P. Kozlowski |
