Parambassis ranga (Indian glassy fish)
Taxonomy: cellular organisms; Eukaryota; Opisthokonta; Metazoa; Eumetazoa; Bilateria; Deuterostomia; Chordata; Craniata; Vertebrata; Gnathostomata; Teleostomi; Euteleostomi; Actinopterygii; Actinopteri; Neopterygii; Teleostei; Osteoglossocephalai; Clupeocephala; Euteleosteomorpha; Neoteleostei;
Average proteome isoelectric point is 6.42
Get precalculated fractions of proteins

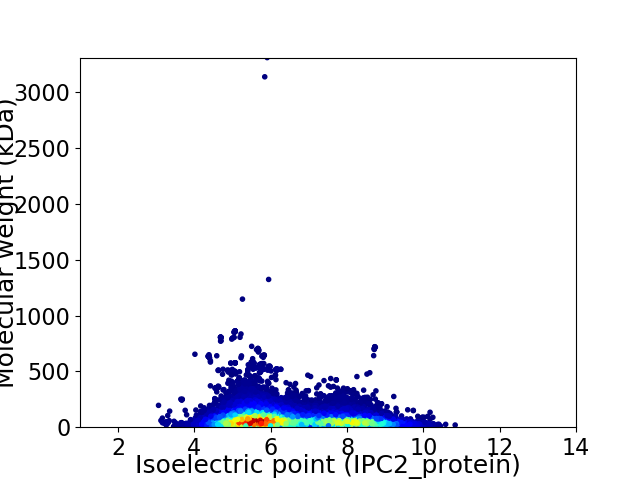
Virtual 2D-PAGE plot for 35559 proteins (isoelectric point calculated using IPC2_protein)
Get csv file with sequences according to given criteria:
* You can choose from 21 different methods for calculating isoelectric point
Summary statistics related to proteome-wise predictions


Protein with the lowest isoelectric point:
>tr|A0A6P7IB55|A0A6P7IB55_9TELE calcium/calmodulin-dependent protein kinase type 1-like OS=Parambassis ranga OX=210632 GN=LOC114436059 PE=3 SV=1
MM1 pKa = 7.28SSKK4 pKa = 10.88GGGLEE9 pKa = 3.71RR10 pKa = 11.84HH11 pKa = 5.94LASLPVISPFRR22 pKa = 11.84PEE24 pKa = 3.5QRR26 pKa = 11.84YY27 pKa = 6.26TCSARR32 pKa = 11.84VSSAEE37 pKa = 3.78GVQEE41 pKa = 3.96SDD43 pKa = 4.77RR44 pKa = 11.84PSDD47 pKa = 3.65DD48 pKa = 3.12QAASNQPSDD57 pKa = 3.52VQAACNQPSDD67 pKa = 4.17DD68 pKa = 3.91QAASNQPSDD77 pKa = 3.52VQAACNQPPSDD88 pKa = 3.94NQAACNQPSDD98 pKa = 3.7NQAACNQPSDD108 pKa = 3.7VQAACNQPSDD118 pKa = 4.17DD119 pKa = 3.91QAASNQPSDD128 pKa = 4.46DD129 pKa = 3.55QAACNQPADD138 pKa = 4.13DD139 pKa = 4.22QAASNQPSDD148 pKa = 3.52VQAACNQPSDD158 pKa = 4.17DD159 pKa = 3.91QAASNQPSDD168 pKa = 3.55NQAACNQPADD178 pKa = 4.19DD179 pKa = 4.82QAACNQPSDD188 pKa = 3.7VQAASNQPVTSPQTTRR204 pKa = 11.84QPVTSPQTTRR214 pKa = 11.84QPVTSPQTTRR224 pKa = 11.84QPVTSPQTTRR234 pKa = 11.84QPVTSLL240 pKa = 3.17
MM1 pKa = 7.28SSKK4 pKa = 10.88GGGLEE9 pKa = 3.71RR10 pKa = 11.84HH11 pKa = 5.94LASLPVISPFRR22 pKa = 11.84PEE24 pKa = 3.5QRR26 pKa = 11.84YY27 pKa = 6.26TCSARR32 pKa = 11.84VSSAEE37 pKa = 3.78GVQEE41 pKa = 3.96SDD43 pKa = 4.77RR44 pKa = 11.84PSDD47 pKa = 3.65DD48 pKa = 3.12QAASNQPSDD57 pKa = 3.52VQAACNQPSDD67 pKa = 4.17DD68 pKa = 3.91QAASNQPSDD77 pKa = 3.52VQAACNQPPSDD88 pKa = 3.94NQAACNQPSDD98 pKa = 3.7NQAACNQPSDD108 pKa = 3.7VQAACNQPSDD118 pKa = 4.17DD119 pKa = 3.91QAASNQPSDD128 pKa = 4.46DD129 pKa = 3.55QAACNQPADD138 pKa = 4.13DD139 pKa = 4.22QAASNQPSDD148 pKa = 3.52VQAACNQPSDD158 pKa = 4.17DD159 pKa = 3.91QAASNQPSDD168 pKa = 3.55NQAACNQPADD178 pKa = 4.19DD179 pKa = 4.82QAACNQPSDD188 pKa = 3.7VQAASNQPVTSPQTTRR204 pKa = 11.84QPVTSPQTTRR214 pKa = 11.84QPVTSPQTTRR224 pKa = 11.84QPVTSPQTTRR234 pKa = 11.84QPVTSLL240 pKa = 3.17
Molecular weight: 25.0 kDa
Isoelectric point according different methods:
Protein with the highest isoelectric point:
>tr|A0A6P7J7L1|A0A6P7J7L1_9TELE uncharacterized protein LOC114443065 OS=Parambassis ranga OX=210632 GN=LOC114443065 PE=4 SV=1
MM1 pKa = 7.57SSHH4 pKa = 5.15KK5 pKa = 8.91TFRR8 pKa = 11.84IKK10 pKa = 10.64RR11 pKa = 11.84FLAKK15 pKa = 9.71KK16 pKa = 9.58QKK18 pKa = 8.69QNRR21 pKa = 11.84PIPQWIRR28 pKa = 11.84MKK30 pKa = 9.89TGNKK34 pKa = 8.61IRR36 pKa = 11.84YY37 pKa = 7.09NSKK40 pKa = 8.3RR41 pKa = 11.84RR42 pKa = 11.84HH43 pKa = 3.95WRR45 pKa = 11.84RR46 pKa = 11.84TKK48 pKa = 10.83LGLL51 pKa = 3.67
MM1 pKa = 7.57SSHH4 pKa = 5.15KK5 pKa = 8.91TFRR8 pKa = 11.84IKK10 pKa = 10.64RR11 pKa = 11.84FLAKK15 pKa = 9.71KK16 pKa = 9.58QKK18 pKa = 8.69QNRR21 pKa = 11.84PIPQWIRR28 pKa = 11.84MKK30 pKa = 9.89TGNKK34 pKa = 8.61IRR36 pKa = 11.84YY37 pKa = 7.09NSKK40 pKa = 8.3RR41 pKa = 11.84RR42 pKa = 11.84HH43 pKa = 3.95WRR45 pKa = 11.84RR46 pKa = 11.84TKK48 pKa = 10.83LGLL51 pKa = 3.67
Molecular weight: 6.41 kDa
Isoelectric point according different methods:
Peptides (in silico digests for buttom-up proteomics)
Below you can find in silico digests of the whole proteome with Trypsin, Chymotrypsin, Trypsin+LysC, LysN, ArgC proteases suitable for different mass spec machines.| Try ESI |
 |
|---|
| ChTry ESI |
 |
|---|
| ArgC ESI |
 |
|---|
| LysN ESI |
 |
|---|
| TryLysC ESI |
 |
|---|
| Try MALDI |
 |
|---|
| ChTry MALDI |
 |
|---|
| ArgC MALDI |
 |
|---|
| LysN MALDI |
 |
|---|
| TryLysC MALDI |
 |
|---|
| Try LTQ |
 |
|---|
| ChTry LTQ |
 |
|---|
| ArgC LTQ |
 |
|---|
| LysN LTQ |
 |
|---|
| TryLysC LTQ |
 |
|---|
| Try MSlow |
 |
|---|
| ChTry MSlow |
 |
|---|
| ArgC MSlow |
 |
|---|
| LysN MSlow |
 |
|---|
| TryLysC MSlow |
 |
|---|
| Try MShigh |
 |
|---|
| ChTry MShigh |
 |
|---|
| ArgC MShigh |
 |
|---|
| LysN MShigh |
 |
|---|
| TryLysC MShigh |
 |
|---|
General Statistics
Number of major isoforms |
Number of additional isoforms |
Number of all proteins |
Number of amino acids |
Min. Seq. Length |
Max. Seq. Length |
Avg. Seq. Length |
Avg. Mol. Weight |
|---|---|---|---|---|---|---|---|
26690903 |
31 |
30257 |
750.6 |
83.55 |
Amino acid frequency
Ala |
Cys |
Asp |
Glu |
Phe |
Gly |
His |
Ile |
Lys |
Leu |
|---|---|---|---|---|---|---|---|---|---|
6.62 ± 0.01 | 2.1 ± 0.011 |
5.296 ± 0.008 | 7.158 ± 0.02 |
3.277 ± 0.01 | 6.22 ± 0.018 |
2.64 ± 0.007 | 4.205 ± 0.009 |
5.673 ± 0.017 | 9.248 ± 0.017 |
Met |
Asn |
Gln |
Pro |
Arg |
Ser |
Thr |
Val |
Trp |
Tyr |
|---|---|---|---|---|---|---|---|---|---|
2.322 ± 0.006 | 3.789 ± 0.01 |
5.998 ± 0.018 | 5.0 ± 0.015 |
5.607 ± 0.012 | 9.088 ± 0.018 |
5.896 ± 0.018 | 6.216 ± 0.011 |
1.054 ± 0.004 | 2.59 ± 0.008 |
Most of the basic statistics you can see at this page can be downloaded from this CSV file
Proteome-pI is available under Creative Commons Attribution-NoDerivs license, for more details see here
| Reference: Kozlowski LP. Proteome-pI 2.0: Proteome Isoelectric Point Database Update. Nucleic Acids Res. 2021, doi: 10.1093/nar/gkab944 | Contact: Lukasz P. Kozlowski |
