Mycobacterium sp. NAZ190054
Taxonomy: cellular organisms; Bacteria; Terrabacteria group; Actinobacteria; Actinomycetia; Corynebacteriales; Mycobacteriaceae; Mycobacterium; unclassified Mycobacterium
Average proteome isoelectric point is 5.96
Get precalculated fractions of proteins

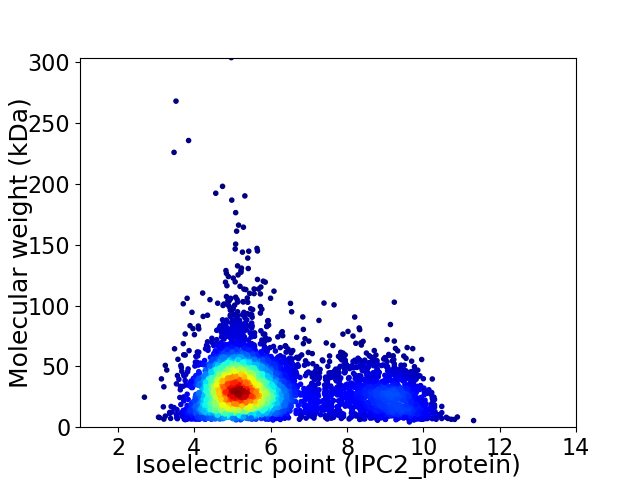
Virtual 2D-PAGE plot for 5363 proteins (isoelectric point calculated using IPC2_protein)
Get csv file with sequences according to given criteria:
* You can choose from 21 different methods for calculating isoelectric point
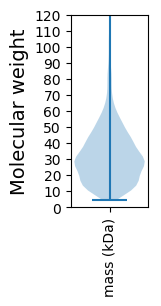
Summary statistics related to proteome-wise predictions


Protein with the lowest isoelectric point:
>tr|A0A132T6L2|A0A132T6L2_9MYCO ESAT-6-like protein OS=Mycobacterium sp. NAZ190054 OX=1747766 GN=ASJ79_23350 PE=3 SV=1
MM1 pKa = 7.24HH2 pKa = 7.22WTRR5 pKa = 11.84PLAALSALGLLMTTVGCTTQVSGVARR31 pKa = 11.84VDD33 pKa = 3.32PTAAPLALTEE43 pKa = 4.91DD44 pKa = 3.94GFGVVAGFDD53 pKa = 3.6DD54 pKa = 4.82APAKK58 pKa = 10.36IEE60 pKa = 4.45IYY62 pKa = 9.98TEE64 pKa = 4.37PQCSHH69 pKa = 6.9CSDD72 pKa = 3.67LQYY75 pKa = 11.6DD76 pKa = 4.39FGDD79 pKa = 3.42EE80 pKa = 3.63LAYY83 pKa = 10.88NITVGTLQVTYY94 pKa = 10.63RR95 pKa = 11.84PLTFLDD101 pKa = 4.07DD102 pKa = 4.61DD103 pKa = 4.76YY104 pKa = 11.79NGYY107 pKa = 8.03SAKK110 pKa = 10.22VANALFLAADD120 pKa = 3.77AVGDD124 pKa = 4.03SAATGTQLQRR134 pKa = 11.84FVYY137 pKa = 8.97EE138 pKa = 3.68LWINQQPGGPEE149 pKa = 3.7FTGDD153 pKa = 3.72EE154 pKa = 4.52LRR156 pKa = 11.84DD157 pKa = 3.53MAADD161 pKa = 3.49AGVPDD166 pKa = 4.37VVADD170 pKa = 4.6HH171 pKa = 7.05IGTDD175 pKa = 3.5AEE177 pKa = 4.23AVDD180 pKa = 4.19VVEE183 pKa = 4.05MDD185 pKa = 3.38EE186 pKa = 4.65TNFDD190 pKa = 4.22LLFDD194 pKa = 4.0IDD196 pKa = 3.84RR197 pKa = 11.84VEE199 pKa = 4.25TGTPTVFDD207 pKa = 4.71LNAGEE212 pKa = 5.52KK213 pKa = 9.58IDD215 pKa = 4.63IYY217 pKa = 11.4DD218 pKa = 4.32DD219 pKa = 3.05AWLADD224 pKa = 3.95LVAGG228 pKa = 4.82
MM1 pKa = 7.24HH2 pKa = 7.22WTRR5 pKa = 11.84PLAALSALGLLMTTVGCTTQVSGVARR31 pKa = 11.84VDD33 pKa = 3.32PTAAPLALTEE43 pKa = 4.91DD44 pKa = 3.94GFGVVAGFDD53 pKa = 3.6DD54 pKa = 4.82APAKK58 pKa = 10.36IEE60 pKa = 4.45IYY62 pKa = 9.98TEE64 pKa = 4.37PQCSHH69 pKa = 6.9CSDD72 pKa = 3.67LQYY75 pKa = 11.6DD76 pKa = 4.39FGDD79 pKa = 3.42EE80 pKa = 3.63LAYY83 pKa = 10.88NITVGTLQVTYY94 pKa = 10.63RR95 pKa = 11.84PLTFLDD101 pKa = 4.07DD102 pKa = 4.61DD103 pKa = 4.76YY104 pKa = 11.79NGYY107 pKa = 8.03SAKK110 pKa = 10.22VANALFLAADD120 pKa = 3.77AVGDD124 pKa = 4.03SAATGTQLQRR134 pKa = 11.84FVYY137 pKa = 8.97EE138 pKa = 3.68LWINQQPGGPEE149 pKa = 3.7FTGDD153 pKa = 3.72EE154 pKa = 4.52LRR156 pKa = 11.84DD157 pKa = 3.53MAADD161 pKa = 3.49AGVPDD166 pKa = 4.37VVADD170 pKa = 4.6HH171 pKa = 7.05IGTDD175 pKa = 3.5AEE177 pKa = 4.23AVDD180 pKa = 4.19VVEE183 pKa = 4.05MDD185 pKa = 3.38EE186 pKa = 4.65TNFDD190 pKa = 4.22LLFDD194 pKa = 4.0IDD196 pKa = 3.84RR197 pKa = 11.84VEE199 pKa = 4.25TGTPTVFDD207 pKa = 4.71LNAGEE212 pKa = 5.52KK213 pKa = 9.58IDD215 pKa = 4.63IYY217 pKa = 11.4DD218 pKa = 4.32DD219 pKa = 3.05AWLADD224 pKa = 3.95LVAGG228 pKa = 4.82
Molecular weight: 24.44 kDa
Isoelectric point according different methods:
Protein with the highest isoelectric point:
>tr|A0A132T752|A0A132T752_9MYCO Hydrolase OS=Mycobacterium sp. NAZ190054 OX=1747766 GN=ASJ79_22950 PE=4 SV=1
MM1 pKa = 7.69AKK3 pKa = 10.06GKK5 pKa = 8.69RR6 pKa = 11.84TFQPNNRR13 pKa = 11.84RR14 pKa = 11.84RR15 pKa = 11.84AKK17 pKa = 9.45VHH19 pKa = 5.31GFRR22 pKa = 11.84LRR24 pKa = 11.84MRR26 pKa = 11.84TRR28 pKa = 11.84AGRR31 pKa = 11.84AIVTARR37 pKa = 11.84RR38 pKa = 11.84AKK40 pKa = 10.16GRR42 pKa = 11.84RR43 pKa = 11.84SLTAA47 pKa = 3.9
MM1 pKa = 7.69AKK3 pKa = 10.06GKK5 pKa = 8.69RR6 pKa = 11.84TFQPNNRR13 pKa = 11.84RR14 pKa = 11.84RR15 pKa = 11.84AKK17 pKa = 9.45VHH19 pKa = 5.31GFRR22 pKa = 11.84LRR24 pKa = 11.84MRR26 pKa = 11.84TRR28 pKa = 11.84AGRR31 pKa = 11.84AIVTARR37 pKa = 11.84RR38 pKa = 11.84AKK40 pKa = 10.16GRR42 pKa = 11.84RR43 pKa = 11.84SLTAA47 pKa = 3.9
Molecular weight: 5.46 kDa
Isoelectric point according different methods:
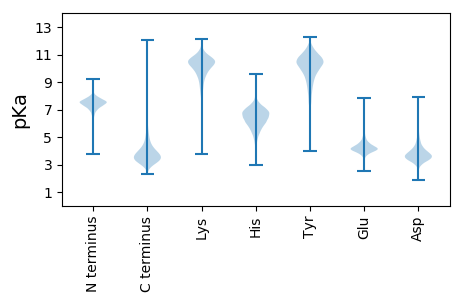
Peptides (in silico digests for buttom-up proteomics)
Below you can find in silico digests of the whole proteome with Trypsin, Chymotrypsin, Trypsin+LysC, LysN, ArgC proteases suitable for different mass spec machines.| Try ESI |
 |
|---|
| ChTry ESI |
 |
|---|
| ArgC ESI |
 |
|---|
| LysN ESI |
 |
|---|
| TryLysC ESI |
 |
|---|
| Try MALDI |
 |
|---|
| ChTry MALDI |
 |
|---|
| ArgC MALDI |
 |
|---|
| LysN MALDI |
 |
|---|
| TryLysC MALDI |
 |
|---|
| Try LTQ |
 |
|---|
| ChTry LTQ |
 |
|---|
| ArgC LTQ |
 |
|---|
| LysN LTQ |
 |
|---|
| TryLysC LTQ |
 |
|---|
| Try MSlow |
 |
|---|
| ChTry MSlow |
 |
|---|
| ArgC MSlow |
 |
|---|
| LysN MSlow |
 |
|---|
| TryLysC MSlow |
 |
|---|
| Try MShigh |
 |
|---|
| ChTry MShigh |
 |
|---|
| ArgC MShigh |
 |
|---|
| LysN MShigh |
 |
|---|
| TryLysC MShigh |
 |
|---|
General Statistics
Number of major isoforms |
Number of additional isoforms |
Number of all proteins |
Number of amino acids |
Min. Seq. Length |
Max. Seq. Length |
Avg. Seq. Length |
Avg. Mol. Weight |
|---|---|---|---|---|---|---|---|
0 |
1672165 |
37 |
2846 |
311.8 |
33.53 |
Amino acid frequency
Ala |
Cys |
Asp |
Glu |
Phe |
Gly |
His |
Ile |
Lys |
Leu |
|---|---|---|---|---|---|---|---|---|---|
12.75 ± 0.04 | 0.816 ± 0.01 |
6.468 ± 0.03 | 5.45 ± 0.027 |
3.16 ± 0.019 | 8.921 ± 0.032 |
2.188 ± 0.017 | 4.23 ± 0.025 |
2.125 ± 0.023 | 9.77 ± 0.033 |
Met |
Asn |
Gln |
Pro |
Arg |
Ser |
Thr |
Val |
Trp |
Tyr |
|---|---|---|---|---|---|---|---|---|---|
2.115 ± 0.014 | 2.158 ± 0.018 |
5.693 ± 0.023 | 2.879 ± 0.017 |
7.312 ± 0.033 | 5.285 ± 0.021 |
6.077 ± 0.024 | 8.952 ± 0.03 |
1.485 ± 0.013 | 2.166 ± 0.014 |
Most of the basic statistics you can see at this page can be downloaded from this CSV file
Proteome-pI is available under Creative Commons Attribution-NoDerivs license, for more details see here
| Reference: Kozlowski LP. Proteome-pI 2.0: Proteome Isoelectric Point Database Update. Nucleic Acids Res. 2021, doi: 10.1093/nar/gkab944 | Contact: Lukasz P. Kozlowski |
