Mycolicibacterium vanbaalenii (Mycobacterium vanbaalenii)
Taxonomy: cellular organisms; Bacteria; Terrabacteria group; Actinobacteria; Actinomycetia; Corynebacteriales; Mycobacteriaceae;
Average proteome isoelectric point is 5.91
Get precalculated fractions of proteins

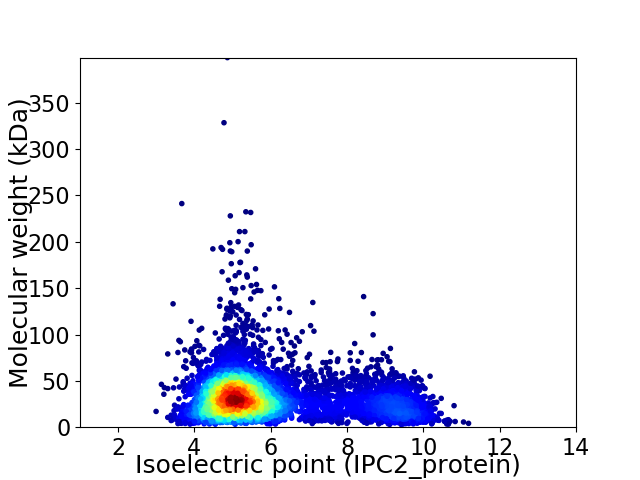
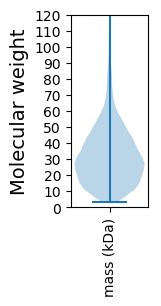
Virtual 2D-PAGE plot for 6378 proteins (isoelectric point calculated using IPC2_protein)
Get csv file with sequences according to given criteria:
* You can choose from 21 different methods for calculating isoelectric point
Summary statistics related to proteome-wise predictions


Protein with the lowest isoelectric point:
>tr|A0A5S9MZ60|A0A5S9MZ60_MYCVN Uric acid degradation bifunctional protein OS=Mycolicibacterium vanbaalenii OX=110539 GN=uao_2 PE=4 SV=1
MM1 pKa = 7.53RR2 pKa = 11.84VFAASLILATPFALSACGSNDD23 pKa = 2.77EE24 pKa = 4.28TAAPSGTSPAADD36 pKa = 3.98GEE38 pKa = 4.81CPATPVDD45 pKa = 3.81VVVSVDD51 pKa = 3.04QWGDD55 pKa = 3.03IVSQLGGACANVTTVLASSSVDD77 pKa = 3.12PHH79 pKa = 8.5DD80 pKa = 4.55YY81 pKa = 11.01EE82 pKa = 4.77PAPSDD87 pKa = 3.18AALFDD92 pKa = 3.88GAQLVVINGGHH103 pKa = 5.48YY104 pKa = 10.46DD105 pKa = 3.18EE106 pKa = 5.19WAAKK110 pKa = 9.31LAAASAPDD118 pKa = 3.82APIVNAVEE126 pKa = 4.35SSGGHH131 pKa = 6.1ADD133 pKa = 3.99EE134 pKa = 5.92AGHH137 pKa = 6.64DD138 pKa = 3.95HH139 pKa = 7.85DD140 pKa = 6.06GGEE143 pKa = 4.3ADD145 pKa = 4.44HH146 pKa = 7.37DD147 pKa = 3.54QDD149 pKa = 3.81QDD151 pKa = 3.39HH152 pKa = 7.19DD153 pKa = 4.28HH154 pKa = 7.13DD155 pKa = 4.65HH156 pKa = 7.09ADD158 pKa = 3.79EE159 pKa = 5.29AGHH162 pKa = 6.48DD163 pKa = 3.83HH164 pKa = 7.05AGEE167 pKa = 4.54GNPHH171 pKa = 4.99VWYY174 pKa = 10.09SPSVVTSVAEE184 pKa = 3.97AVTGEE189 pKa = 4.12LSEE192 pKa = 4.68LAPDD196 pKa = 3.33AAGYY200 pKa = 10.26FDD202 pKa = 4.06EE203 pKa = 4.89RR204 pKa = 11.84HH205 pKa = 4.92TAFEE209 pKa = 4.31NVMTPYY215 pKa = 10.41YY216 pKa = 9.86DD217 pKa = 3.74TIAAIKK223 pKa = 9.65ADD225 pKa = 3.77SVGKK229 pKa = 10.46SFAATEE235 pKa = 4.4SVFDD239 pKa = 4.97DD240 pKa = 3.32MGAALGLQNRR250 pKa = 11.84TPEE253 pKa = 4.79GYY255 pKa = 10.07QLASSNEE262 pKa = 4.01AEE264 pKa = 4.63PAPADD269 pKa = 3.42LDD271 pKa = 3.66AFLRR275 pKa = 11.84LLGDD279 pKa = 3.36RR280 pKa = 11.84GVDD283 pKa = 3.18VLIYY287 pKa = 8.68NTQTEE292 pKa = 4.55GSVPEE297 pKa = 4.21QIRR300 pKa = 11.84AAAEE304 pKa = 3.8QAGVPVVEE312 pKa = 4.67VTEE315 pKa = 4.27TVPPNTEE322 pKa = 4.42SFQTWQVAQLDD333 pKa = 4.29SLAEE337 pKa = 3.94ALGVPVV343 pKa = 4.15
MM1 pKa = 7.53RR2 pKa = 11.84VFAASLILATPFALSACGSNDD23 pKa = 2.77EE24 pKa = 4.28TAAPSGTSPAADD36 pKa = 3.98GEE38 pKa = 4.81CPATPVDD45 pKa = 3.81VVVSVDD51 pKa = 3.04QWGDD55 pKa = 3.03IVSQLGGACANVTTVLASSSVDD77 pKa = 3.12PHH79 pKa = 8.5DD80 pKa = 4.55YY81 pKa = 11.01EE82 pKa = 4.77PAPSDD87 pKa = 3.18AALFDD92 pKa = 3.88GAQLVVINGGHH103 pKa = 5.48YY104 pKa = 10.46DD105 pKa = 3.18EE106 pKa = 5.19WAAKK110 pKa = 9.31LAAASAPDD118 pKa = 3.82APIVNAVEE126 pKa = 4.35SSGGHH131 pKa = 6.1ADD133 pKa = 3.99EE134 pKa = 5.92AGHH137 pKa = 6.64DD138 pKa = 3.95HH139 pKa = 7.85DD140 pKa = 6.06GGEE143 pKa = 4.3ADD145 pKa = 4.44HH146 pKa = 7.37DD147 pKa = 3.54QDD149 pKa = 3.81QDD151 pKa = 3.39HH152 pKa = 7.19DD153 pKa = 4.28HH154 pKa = 7.13DD155 pKa = 4.65HH156 pKa = 7.09ADD158 pKa = 3.79EE159 pKa = 5.29AGHH162 pKa = 6.48DD163 pKa = 3.83HH164 pKa = 7.05AGEE167 pKa = 4.54GNPHH171 pKa = 4.99VWYY174 pKa = 10.09SPSVVTSVAEE184 pKa = 3.97AVTGEE189 pKa = 4.12LSEE192 pKa = 4.68LAPDD196 pKa = 3.33AAGYY200 pKa = 10.26FDD202 pKa = 4.06EE203 pKa = 4.89RR204 pKa = 11.84HH205 pKa = 4.92TAFEE209 pKa = 4.31NVMTPYY215 pKa = 10.41YY216 pKa = 9.86DD217 pKa = 3.74TIAAIKK223 pKa = 9.65ADD225 pKa = 3.77SVGKK229 pKa = 10.46SFAATEE235 pKa = 4.4SVFDD239 pKa = 4.97DD240 pKa = 3.32MGAALGLQNRR250 pKa = 11.84TPEE253 pKa = 4.79GYY255 pKa = 10.07QLASSNEE262 pKa = 4.01AEE264 pKa = 4.63PAPADD269 pKa = 3.42LDD271 pKa = 3.66AFLRR275 pKa = 11.84LLGDD279 pKa = 3.36RR280 pKa = 11.84GVDD283 pKa = 3.18VLIYY287 pKa = 8.68NTQTEE292 pKa = 4.55GSVPEE297 pKa = 4.21QIRR300 pKa = 11.84AAAEE304 pKa = 3.8QAGVPVVEE312 pKa = 4.67VTEE315 pKa = 4.27TVPPNTEE322 pKa = 4.42SFQTWQVAQLDD333 pKa = 4.29SLAEE337 pKa = 3.94ALGVPVV343 pKa = 4.15
Molecular weight: 35.49 kDa
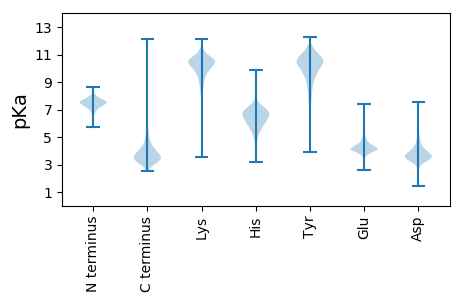
Isoelectric point according different methods:
Protein with the highest isoelectric point:
>tr|A0A5S9PXT8|A0A5S9PXT8_MYCVN Uncharacterized protein OS=Mycolicibacterium vanbaalenii OX=110539 GN=AELLOGFF_00726 PE=4 SV=1
MM1 pKa = 7.4GSVIKK6 pKa = 10.38KK7 pKa = 8.42RR8 pKa = 11.84RR9 pKa = 11.84KK10 pKa = 9.06RR11 pKa = 11.84MSKK14 pKa = 9.76KK15 pKa = 9.54KK16 pKa = 9.72HH17 pKa = 5.63RR18 pKa = 11.84KK19 pKa = 7.56LLRR22 pKa = 11.84RR23 pKa = 11.84TRR25 pKa = 11.84VQRR28 pKa = 11.84RR29 pKa = 11.84KK30 pKa = 10.11LGKK33 pKa = 9.87
MM1 pKa = 7.4GSVIKK6 pKa = 10.38KK7 pKa = 8.42RR8 pKa = 11.84RR9 pKa = 11.84KK10 pKa = 9.06RR11 pKa = 11.84MSKK14 pKa = 9.76KK15 pKa = 9.54KK16 pKa = 9.72HH17 pKa = 5.63RR18 pKa = 11.84KK19 pKa = 7.56LLRR22 pKa = 11.84RR23 pKa = 11.84TRR25 pKa = 11.84VQRR28 pKa = 11.84RR29 pKa = 11.84KK30 pKa = 10.11LGKK33 pKa = 9.87
Molecular weight: 4.15 kDa
Isoelectric point according different methods:
Peptides (in silico digests for buttom-up proteomics)
Below you can find in silico digests of the whole proteome with Trypsin, Chymotrypsin, Trypsin+LysC, LysN, ArgC proteases suitable for different mass spec machines.| Try ESI |
 |
|---|
| ChTry ESI |
 |
|---|
| ArgC ESI |
 |
|---|
| LysN ESI |
 |
|---|
| TryLysC ESI |
 |
|---|
| Try MALDI |
 |
|---|
| ChTry MALDI |
 |
|---|
| ArgC MALDI |
 |
|---|
| LysN MALDI |
 |
|---|
| TryLysC MALDI |
 |
|---|
| Try LTQ |
 |
|---|
| ChTry LTQ |
 |
|---|
| ArgC LTQ |
 |
|---|
| LysN LTQ |
 |
|---|
| TryLysC LTQ |
 |
|---|
| Try MSlow |
 |
|---|
| ChTry MSlow |
 |
|---|
| ArgC MSlow |
 |
|---|
| LysN MSlow |
 |
|---|
| TryLysC MSlow |
 |
|---|
| Try MShigh |
 |
|---|
| ChTry MShigh |
 |
|---|
| ArgC MShigh |
 |
|---|
| LysN MShigh |
 |
|---|
| TryLysC MShigh |
 |
|---|
General Statistics
Number of major isoforms |
Number of additional isoforms |
Number of all proteins |
Number of amino acids |
Min. Seq. Length |
Max. Seq. Length |
Avg. Seq. Length |
Avg. Mol. Weight |
|---|---|---|---|---|---|---|---|
0 |
2015758 |
29 |
3732 |
316.0 |
33.94 |
Amino acid frequency
Ala |
Cys |
Asp |
Glu |
Phe |
Gly |
His |
Ile |
Lys |
Leu |
|---|---|---|---|---|---|---|---|---|---|
12.849 ± 0.04 | 0.825 ± 0.01 |
6.447 ± 0.026 | 5.383 ± 0.028 |
3.059 ± 0.019 | 8.851 ± 0.03 |
2.184 ± 0.016 | 4.202 ± 0.019 |
2.072 ± 0.019 | 9.738 ± 0.031 |
Met |
Asn |
Gln |
Pro |
Arg |
Ser |
Thr |
Val |
Trp |
Tyr |
|---|---|---|---|---|---|---|---|---|---|
2.12 ± 0.013 | 2.202 ± 0.013 |
5.795 ± 0.024 | 3.013 ± 0.017 |
7.21 ± 0.028 | 5.55 ± 0.021 |
6.12 ± 0.024 | 8.769 ± 0.027 |
1.514 ± 0.013 | 2.092 ± 0.014 |
Most of the basic statistics you can see at this page can be downloaded from this CSV file
Proteome-pI is available under Creative Commons Attribution-NoDerivs license, for more details see here
| Reference: Kozlowski LP. Proteome-pI 2.0: Proteome Isoelectric Point Database Update. Nucleic Acids Res. 2021, doi: 10.1093/nar/gkab944 | Contact: Lukasz P. Kozlowski |
