Flavobacterium fontis
Taxonomy: cellular organisms; Bacteria; FCB group; Bacteroidetes/Chlorobi group; Bacteroidetes; Flavobacteriia; Flavobacteriales; Flavobacteriaceae; Flavobacterium
Average proteome isoelectric point is 6.69
Get precalculated fractions of proteins

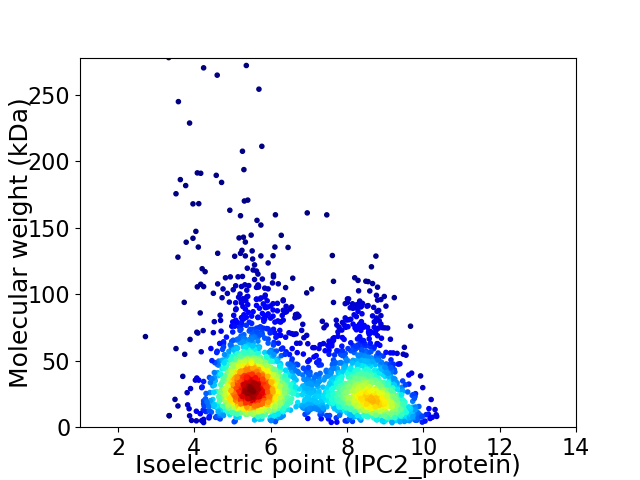
Virtual 2D-PAGE plot for 2756 proteins (isoelectric point calculated using IPC2_protein)
Get csv file with sequences according to given criteria:
* You can choose from 21 different methods for calculating isoelectric point
Summary statistics related to proteome-wise predictions


Protein with the lowest isoelectric point:
>tr|A0A1M5C9R6|A0A1M5C9R6_9FLAO Uncharacterized protein OS=Flavobacterium fontis OX=1124188 GN=SAMN05444377_11113 PE=4 SV=1
MM1 pKa = 7.32FKK3 pKa = 10.74KK4 pKa = 10.7LLFFGILLTMMSCEE18 pKa = 4.16KK19 pKa = 10.63EE20 pKa = 4.31SLTEE24 pKa = 3.91TTSNSNLTQSSLLTGLLKK42 pKa = 10.62RR43 pKa = 11.84IAQNPTAFDD52 pKa = 3.69NVLDD56 pKa = 4.35GCSGFSVVLPVTVTVNGSTITVASEE81 pKa = 4.22SDD83 pKa = 3.5FQTVQNIKK91 pKa = 10.19NAYY94 pKa = 10.14SNDD97 pKa = 3.24TDD99 pKa = 3.77EE100 pKa = 5.72VFFTYY105 pKa = 9.9PIQLRR110 pKa = 11.84LKK112 pKa = 8.22NHH114 pKa = 5.58QLVTVTSYY122 pKa = 11.49NQFEE126 pKa = 4.79DD127 pKa = 4.35LYY129 pKa = 10.44EE130 pKa = 5.16DD131 pKa = 4.2YY132 pKa = 11.38SSDD135 pKa = 3.46DD136 pKa = 3.51LTEE139 pKa = 3.95IRR141 pKa = 11.84CVNIQFPITINTYY154 pKa = 8.11NTSSQQTQAYY164 pKa = 6.81TLTNDD169 pKa = 2.76VSLYY173 pKa = 10.62QFLASLTPNLQYY185 pKa = 11.18SLSYY189 pKa = 10.23PLTVTDD195 pKa = 5.36ANNNPQTITSNVGFEE210 pKa = 4.3SVIDD214 pKa = 4.27ANLSLCDD221 pKa = 3.67VPVGNTPLSFTTLLTDD237 pKa = 4.22NIWYY241 pKa = 9.14VSSYY245 pKa = 10.86IDD247 pKa = 5.47DD248 pKa = 5.24DD249 pKa = 5.43GSDD252 pKa = 3.59DD253 pKa = 3.6TDD255 pKa = 4.17DD256 pKa = 4.6YY257 pKa = 12.03EE258 pKa = 7.01DD259 pKa = 3.56YY260 pKa = 11.19TFDD263 pKa = 3.62FLSNFDD269 pKa = 3.33IQVFEE274 pKa = 4.59GSLFANGSWNYY285 pKa = 7.95YY286 pKa = 5.43TTGNTQKK293 pKa = 11.24LNLNFSNADD302 pKa = 4.16LLDD305 pKa = 4.8LDD307 pKa = 4.07QDD309 pKa = 3.78WTIVEE314 pKa = 4.14YY315 pKa = 9.87TIGVIRR321 pKa = 11.84LRR323 pKa = 11.84YY324 pKa = 8.89IDD326 pKa = 3.9SDD328 pKa = 3.8NDD330 pKa = 3.22VEE332 pKa = 4.43YY333 pKa = 11.03LVLRR337 pKa = 11.84KK338 pKa = 9.71LL339 pKa = 3.63
MM1 pKa = 7.32FKK3 pKa = 10.74KK4 pKa = 10.7LLFFGILLTMMSCEE18 pKa = 4.16KK19 pKa = 10.63EE20 pKa = 4.31SLTEE24 pKa = 3.91TTSNSNLTQSSLLTGLLKK42 pKa = 10.62RR43 pKa = 11.84IAQNPTAFDD52 pKa = 3.69NVLDD56 pKa = 4.35GCSGFSVVLPVTVTVNGSTITVASEE81 pKa = 4.22SDD83 pKa = 3.5FQTVQNIKK91 pKa = 10.19NAYY94 pKa = 10.14SNDD97 pKa = 3.24TDD99 pKa = 3.77EE100 pKa = 5.72VFFTYY105 pKa = 9.9PIQLRR110 pKa = 11.84LKK112 pKa = 8.22NHH114 pKa = 5.58QLVTVTSYY122 pKa = 11.49NQFEE126 pKa = 4.79DD127 pKa = 4.35LYY129 pKa = 10.44EE130 pKa = 5.16DD131 pKa = 4.2YY132 pKa = 11.38SSDD135 pKa = 3.46DD136 pKa = 3.51LTEE139 pKa = 3.95IRR141 pKa = 11.84CVNIQFPITINTYY154 pKa = 8.11NTSSQQTQAYY164 pKa = 6.81TLTNDD169 pKa = 2.76VSLYY173 pKa = 10.62QFLASLTPNLQYY185 pKa = 11.18SLSYY189 pKa = 10.23PLTVTDD195 pKa = 5.36ANNNPQTITSNVGFEE210 pKa = 4.3SVIDD214 pKa = 4.27ANLSLCDD221 pKa = 3.67VPVGNTPLSFTTLLTDD237 pKa = 4.22NIWYY241 pKa = 9.14VSSYY245 pKa = 10.86IDD247 pKa = 5.47DD248 pKa = 5.24DD249 pKa = 5.43GSDD252 pKa = 3.59DD253 pKa = 3.6TDD255 pKa = 4.17DD256 pKa = 4.6YY257 pKa = 12.03EE258 pKa = 7.01DD259 pKa = 3.56YY260 pKa = 11.19TFDD263 pKa = 3.62FLSNFDD269 pKa = 3.33IQVFEE274 pKa = 4.59GSLFANGSWNYY285 pKa = 7.95YY286 pKa = 5.43TTGNTQKK293 pKa = 11.24LNLNFSNADD302 pKa = 4.16LLDD305 pKa = 4.8LDD307 pKa = 4.07QDD309 pKa = 3.78WTIVEE314 pKa = 4.14YY315 pKa = 9.87TIGVIRR321 pKa = 11.84LRR323 pKa = 11.84YY324 pKa = 8.89IDD326 pKa = 3.9SDD328 pKa = 3.8NDD330 pKa = 3.22VEE332 pKa = 4.43YY333 pKa = 11.03LVLRR337 pKa = 11.84KK338 pKa = 9.71LL339 pKa = 3.63
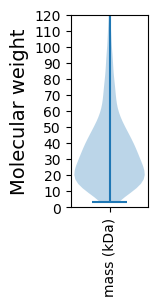
Molecular weight: 38.26 kDa
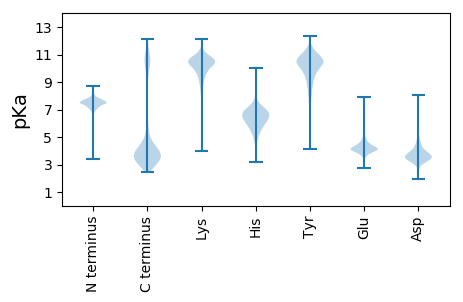
Isoelectric point according different methods:
Protein with the highest isoelectric point:
>tr|A0A1M4VQD7|A0A1M4VQD7_9FLAO Peptidase family M1 OS=Flavobacterium fontis OX=1124188 GN=SAMN05444377_10117 PE=4 SV=1
MM1 pKa = 7.7EE2 pKa = 5.73NGTEE6 pKa = 3.82IKK8 pKa = 10.52QPLTATSRR16 pKa = 11.84YY17 pKa = 8.73GSNFFASTLFSRR29 pKa = 11.84PEE31 pKa = 3.52RR32 pKa = 11.84SEE34 pKa = 4.03RR35 pKa = 11.84CVAKK39 pKa = 10.56NFYY42 pKa = 10.84LSGRR46 pKa = 11.84KK47 pKa = 8.35NFRR50 pKa = 11.84LDD52 pKa = 2.96RR53 pKa = 11.84HH54 pKa = 6.0SRR56 pKa = 11.84LAAEE60 pKa = 4.43RR61 pKa = 3.88
MM1 pKa = 7.7EE2 pKa = 5.73NGTEE6 pKa = 3.82IKK8 pKa = 10.52QPLTATSRR16 pKa = 11.84YY17 pKa = 8.73GSNFFASTLFSRR29 pKa = 11.84PEE31 pKa = 3.52RR32 pKa = 11.84SEE34 pKa = 4.03RR35 pKa = 11.84CVAKK39 pKa = 10.56NFYY42 pKa = 10.84LSGRR46 pKa = 11.84KK47 pKa = 8.35NFRR50 pKa = 11.84LDD52 pKa = 2.96RR53 pKa = 11.84HH54 pKa = 6.0SRR56 pKa = 11.84LAAEE60 pKa = 4.43RR61 pKa = 3.88
Molecular weight: 7.1 kDa
Isoelectric point according different methods:
Peptides (in silico digests for buttom-up proteomics)
Below you can find in silico digests of the whole proteome with Trypsin, Chymotrypsin, Trypsin+LysC, LysN, ArgC proteases suitable for different mass spec machines.| Try ESI |
 |
|---|
| ChTry ESI |
 |
|---|
| ArgC ESI |
 |
|---|
| LysN ESI |
 |
|---|
| TryLysC ESI |
 |
|---|
| Try MALDI |
 |
|---|
| ChTry MALDI |
 |
|---|
| ArgC MALDI |
 |
|---|
| LysN MALDI |
 |
|---|
| TryLysC MALDI |
 |
|---|
| Try LTQ |
 |
|---|
| ChTry LTQ |
 |
|---|
| ArgC LTQ |
 |
|---|
| LysN LTQ |
 |
|---|
| TryLysC LTQ |
 |
|---|
| Try MSlow |
 |
|---|
| ChTry MSlow |
 |
|---|
| ArgC MSlow |
 |
|---|
| LysN MSlow |
 |
|---|
| TryLysC MSlow |
 |
|---|
| Try MShigh |
 |
|---|
| ChTry MShigh |
 |
|---|
| ArgC MShigh |
 |
|---|
| LysN MShigh |
 |
|---|
| TryLysC MShigh |
 |
|---|
General Statistics
Number of major isoforms |
Number of additional isoforms |
Number of all proteins |
Number of amino acids |
Min. Seq. Length |
Max. Seq. Length |
Avg. Seq. Length |
Avg. Mol. Weight |
|---|---|---|---|---|---|---|---|
0 |
933078 |
30 |
2771 |
338.6 |
38.05 |
Amino acid frequency
Ala |
Cys |
Asp |
Glu |
Phe |
Gly |
His |
Ile |
Lys |
Leu |
|---|---|---|---|---|---|---|---|---|---|
7.328 ± 0.048 | 0.891 ± 0.019 |
4.948 ± 0.032 | 6.02 ± 0.062 |
5.257 ± 0.039 | 6.493 ± 0.047 |
1.936 ± 0.029 | 6.98 ± 0.04 |
6.572 ± 0.075 | 9.464 ± 0.06 |
Met |
Asn |
Gln |
Pro |
Arg |
Ser |
Thr |
Val |
Trp |
Tyr |
|---|---|---|---|---|---|---|---|---|---|
2.24 ± 0.028 | 5.581 ± 0.055 |
3.926 ± 0.041 | 4.167 ± 0.033 |
3.83 ± 0.036 | 5.92 ± 0.038 |
6.595 ± 0.101 | 6.67 ± 0.04 |
1.156 ± 0.019 | 4.024 ± 0.031 |
Most of the basic statistics you can see at this page can be downloaded from this CSV file
Proteome-pI is available under Creative Commons Attribution-NoDerivs license, for more details see here
| Reference: Kozlowski LP. Proteome-pI 2.0: Proteome Isoelectric Point Database Update. Nucleic Acids Res. 2021, doi: 10.1093/nar/gkab944 | Contact: Lukasz P. Kozlowski |
