Tortoise microvirus 72
Taxonomy: Viruses; Monodnaviria; Sangervirae; Phixviricota; Malgrandaviricetes; Petitvirales; Microviridae; unclassified Microviridae
Average proteome isoelectric point is 7.07
Get precalculated fractions of proteins

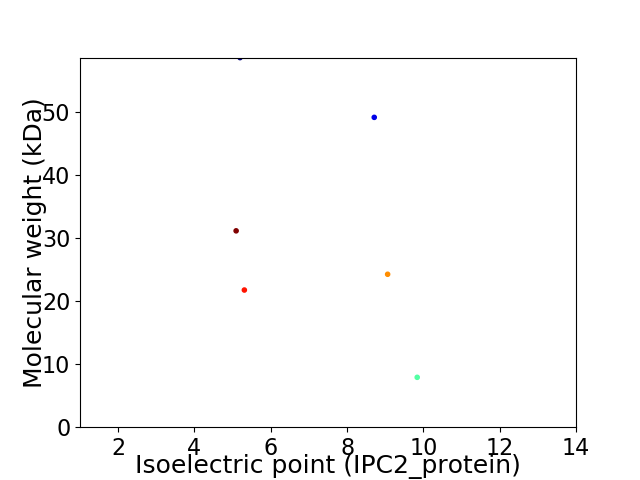
Virtual 2D-PAGE plot for 6 proteins (isoelectric point calculated using IPC2_protein)
Get csv file with sequences according to given criteria:
* You can choose from 21 different methods for calculating isoelectric point
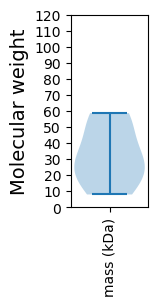
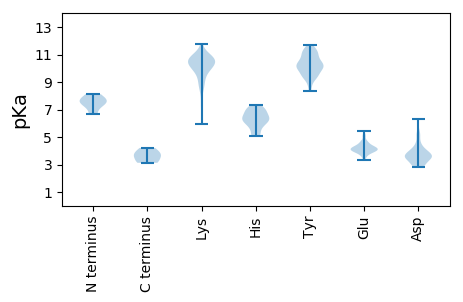
Summary statistics related to proteome-wise predictions


Protein with the lowest isoelectric point:
>tr|A0A4P8WA50|A0A4P8WA50_9VIRU Uncharacterized protein OS=Tortoise microvirus 72 OX=2583179 PE=4 SV=1
MM1 pKa = 7.46AVYY4 pKa = 9.91FSGTGNGGARR14 pKa = 11.84TYY16 pKa = 10.85EE17 pKa = 4.18VGQHH21 pKa = 5.12YY22 pKa = 11.18SNGNGTYY29 pKa = 10.1RR30 pKa = 11.84ANEE33 pKa = 4.39DD34 pKa = 3.33GSFTKK39 pKa = 10.61LGNVVGTTDD48 pKa = 3.14GGRR51 pKa = 11.84VVRR54 pKa = 11.84DD55 pKa = 3.39NTGGQTLQGSAGNPDD70 pKa = 3.52VRR72 pKa = 11.84WYY74 pKa = 9.76ATGNEE79 pKa = 4.18SLASGRR85 pKa = 11.84YY86 pKa = 8.78SPGTAVSLTSASGGHH101 pKa = 6.04NPPPVATPQRR111 pKa = 11.84AGGSGGGGAAGVAAGSGGAVPMANPYY137 pKa = 10.09AIPGRR142 pKa = 11.84GAAAAWSPVRR152 pKa = 11.84DD153 pKa = 3.95AAWSGDD159 pKa = 3.76DD160 pKa = 6.33DD161 pKa = 4.22PAQDD165 pKa = 3.31LRR167 pKa = 11.84MAGFHH172 pKa = 5.09WVSRR176 pKa = 11.84RR177 pKa = 11.84DD178 pKa = 3.35SSNAEE183 pKa = 3.83LAEE186 pKa = 3.8IRR188 pKa = 11.84YY189 pKa = 9.9SDD191 pKa = 2.95IGGNIVGLGVLGLDD205 pKa = 3.7IGDD208 pKa = 3.53NAARR212 pKa = 11.84LMGTRR217 pKa = 11.84FEE219 pKa = 4.52GAGIPRR225 pKa = 11.84GPEE228 pKa = 3.49LAAHH232 pKa = 6.96RR233 pKa = 11.84LSVVSEE239 pKa = 4.05YY240 pKa = 11.72ANAGVDD246 pKa = 3.34AGVAALRR253 pKa = 11.84SAIPADD259 pKa = 3.76VTEE262 pKa = 4.33TRR264 pKa = 11.84HH265 pKa = 6.12DD266 pKa = 3.33GWVSFDD272 pKa = 5.22GGQSWQYY279 pKa = 11.34DD280 pKa = 3.52GTGPAFASDD289 pKa = 3.56PKK291 pKa = 10.59RR292 pKa = 11.84NQGHH296 pKa = 6.06WADD299 pKa = 3.47IVFEE303 pKa = 4.3GTNN306 pKa = 3.13
MM1 pKa = 7.46AVYY4 pKa = 9.91FSGTGNGGARR14 pKa = 11.84TYY16 pKa = 10.85EE17 pKa = 4.18VGQHH21 pKa = 5.12YY22 pKa = 11.18SNGNGTYY29 pKa = 10.1RR30 pKa = 11.84ANEE33 pKa = 4.39DD34 pKa = 3.33GSFTKK39 pKa = 10.61LGNVVGTTDD48 pKa = 3.14GGRR51 pKa = 11.84VVRR54 pKa = 11.84DD55 pKa = 3.39NTGGQTLQGSAGNPDD70 pKa = 3.52VRR72 pKa = 11.84WYY74 pKa = 9.76ATGNEE79 pKa = 4.18SLASGRR85 pKa = 11.84YY86 pKa = 8.78SPGTAVSLTSASGGHH101 pKa = 6.04NPPPVATPQRR111 pKa = 11.84AGGSGGGGAAGVAAGSGGAVPMANPYY137 pKa = 10.09AIPGRR142 pKa = 11.84GAAAAWSPVRR152 pKa = 11.84DD153 pKa = 3.95AAWSGDD159 pKa = 3.76DD160 pKa = 6.33DD161 pKa = 4.22PAQDD165 pKa = 3.31LRR167 pKa = 11.84MAGFHH172 pKa = 5.09WVSRR176 pKa = 11.84RR177 pKa = 11.84DD178 pKa = 3.35SSNAEE183 pKa = 3.83LAEE186 pKa = 3.8IRR188 pKa = 11.84YY189 pKa = 9.9SDD191 pKa = 2.95IGGNIVGLGVLGLDD205 pKa = 3.7IGDD208 pKa = 3.53NAARR212 pKa = 11.84LMGTRR217 pKa = 11.84FEE219 pKa = 4.52GAGIPRR225 pKa = 11.84GPEE228 pKa = 3.49LAAHH232 pKa = 6.96RR233 pKa = 11.84LSVVSEE239 pKa = 4.05YY240 pKa = 11.72ANAGVDD246 pKa = 3.34AGVAALRR253 pKa = 11.84SAIPADD259 pKa = 3.76VTEE262 pKa = 4.33TRR264 pKa = 11.84HH265 pKa = 6.12DD266 pKa = 3.33GWVSFDD272 pKa = 5.22GGQSWQYY279 pKa = 11.34DD280 pKa = 3.52GTGPAFASDD289 pKa = 3.56PKK291 pKa = 10.59RR292 pKa = 11.84NQGHH296 pKa = 6.06WADD299 pKa = 3.47IVFEE303 pKa = 4.3GTNN306 pKa = 3.13
Molecular weight: 31.14 kDa
Isoelectric point according different methods:
Protein with the highest isoelectric point:
>tr|A0A4P8W7P5|A0A4P8W7P5_9VIRU Peptidase_M15_4 domain-containing protein OS=Tortoise microvirus 72 OX=2583179 PE=4 SV=1
MM1 pKa = 7.37EE2 pKa = 5.42LVLRR6 pKa = 11.84TQGTLYY12 pKa = 11.12GEE14 pKa = 4.62TARR17 pKa = 11.84QRR19 pKa = 11.84AALMGLYY26 pKa = 10.16LSSLARR32 pKa = 11.84TRR34 pKa = 11.84EE35 pKa = 3.91RR36 pKa = 11.84GSWLVWPTPVEE47 pKa = 4.15EE48 pKa = 4.06ATGWISRR55 pKa = 11.84DD56 pKa = 2.81LARR59 pKa = 11.84YY60 pKa = 9.0LNRR63 pKa = 11.84ATRR66 pKa = 11.84SLLL69 pKa = 3.63
MM1 pKa = 7.37EE2 pKa = 5.42LVLRR6 pKa = 11.84TQGTLYY12 pKa = 11.12GEE14 pKa = 4.62TARR17 pKa = 11.84QRR19 pKa = 11.84AALMGLYY26 pKa = 10.16LSSLARR32 pKa = 11.84TRR34 pKa = 11.84EE35 pKa = 3.91RR36 pKa = 11.84GSWLVWPTPVEE47 pKa = 4.15EE48 pKa = 4.06ATGWISRR55 pKa = 11.84DD56 pKa = 2.81LARR59 pKa = 11.84YY60 pKa = 9.0LNRR63 pKa = 11.84ATRR66 pKa = 11.84SLLL69 pKa = 3.63
Molecular weight: 7.91 kDa
Isoelectric point according different methods:
Peptides (in silico digests for buttom-up proteomics)
Below you can find in silico digests of the whole proteome with Trypsin, Chymotrypsin, Trypsin+LysC, LysN, ArgC proteases suitable for different mass spec machines.| Try ESI |
 |
|---|
| ChTry ESI |
 |
|---|
| ArgC ESI |
 |
|---|
| LysN ESI |
 |
|---|
| TryLysC ESI |
 |
|---|
| Try MALDI |
 |
|---|
| ChTry MALDI |
 |
|---|
| ArgC MALDI |
 |
|---|
| LysN MALDI |
 |
|---|
| TryLysC MALDI |
 |
|---|
| Try LTQ |
 |
|---|
| ChTry LTQ |
 |
|---|
| ArgC LTQ |
 |
|---|
| LysN LTQ |
 |
|---|
| TryLysC LTQ |
 |
|---|
| Try MSlow |
 |
|---|
| ChTry MSlow |
 |
|---|
| ArgC MSlow |
 |
|---|
| LysN MSlow |
 |
|---|
| TryLysC MSlow |
 |
|---|
| Try MShigh |
 |
|---|
| ChTry MShigh |
 |
|---|
| ArgC MShigh |
 |
|---|
| LysN MShigh |
 |
|---|
| TryLysC MShigh |
 |
|---|
General Statistics
Number of major isoforms |
Number of additional isoforms |
Number of all proteins |
Number of amino acids |
Min. Seq. Length |
Max. Seq. Length |
Avg. Seq. Length |
Avg. Mol. Weight |
|---|---|---|---|---|---|---|---|
0 |
1729 |
69 |
533 |
288.2 |
32.13 |
Amino acid frequency
Ala |
Cys |
Asp |
Glu |
Phe |
Gly |
His |
Ile |
Lys |
Leu |
|---|---|---|---|---|---|---|---|---|---|
9.832 ± 1.068 | 0.463 ± 0.261 |
5.147 ± 0.334 | 6.767 ± 0.91 |
3.412 ± 0.316 | 9.08 ± 1.639 |
2.082 ± 0.419 | 4.338 ± 0.438 |
4.685 ± 1.1 | 6.767 ± 0.714 |
Met |
Asn |
Gln |
Pro |
Arg |
Ser |
Thr |
Val |
Trp |
Tyr |
|---|---|---|---|---|---|---|---|---|---|
1.909 ± 0.298 | 3.875 ± 0.671 |
6.015 ± 0.53 | 4.453 ± 0.698 |
7.403 ± 0.726 | 4.8 ± 0.615 |
5.263 ± 0.753 | 7.403 ± 1.248 |
2.313 ± 0.448 | 3.991 ± 0.623 |
Most of the basic statistics you can see at this page can be downloaded from this CSV file
Proteome-pI is available under Creative Commons Attribution-NoDerivs license, for more details see here
| Reference: Kozlowski LP. Proteome-pI 2.0: Proteome Isoelectric Point Database Update. Nucleic Acids Res. 2021, doi: 10.1093/nar/gkab944 | Contact: Lukasz P. Kozlowski |
