Nocardia nova SH22a
Taxonomy: cellular organisms; Bacteria; Terrabacteria group; Actinobacteria; Actinomycetia; Corynebacteriales; Nocardiaceae; Nocardia; Nocardia nova
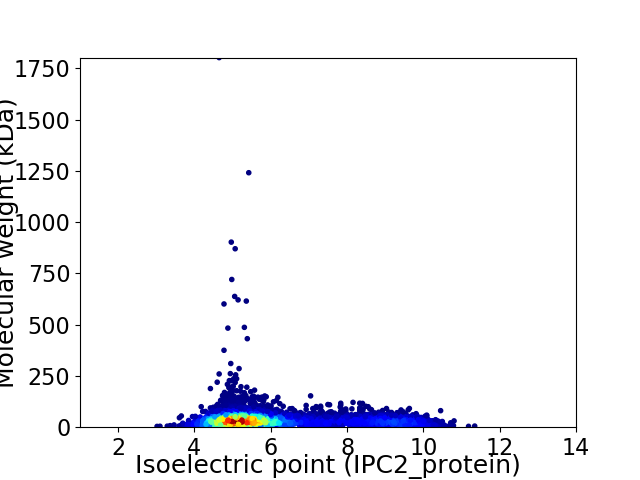
Average proteome isoelectric point is 6.07
Get precalculated fractions of proteins

Virtual 2D-PAGE plot for 7577 proteins (isoelectric point calculated using IPC2_protein)
Get csv file with sequences according to given criteria:
* You can choose from 21 different methods for calculating isoelectric point
Summary statistics related to proteome-wise predictions


Protein with the lowest isoelectric point:
>tr|W5TSL1|W5TSL1_9NOCA Uncharacterized protein OS=Nocardia nova SH22a OX=1415166 GN=NONO_c75470 PE=4 SV=1
MM1 pKa = 7.2TPNAILEE8 pKa = 4.76FILDD12 pKa = 4.13LLRR15 pKa = 11.84DD16 pKa = 3.52HH17 pKa = 6.87EE18 pKa = 4.38AAVGYY23 pKa = 8.81CANPAEE29 pKa = 4.5SLCAAGLTAVTPEE42 pKa = 5.11DD43 pKa = 3.51IAAVAPMVAEE53 pKa = 4.18SALVSGGSQLAAIVAAGGGASGTAGLAGGAATTTEE88 pKa = 4.27ANLGTGAALGAATGIAAGTGLDD110 pKa = 3.64LGAGLGLGANAGIGGDD126 pKa = 3.74LGAGLGAAAAVGAGLEE142 pKa = 4.21AGLTAGLGALTGVAVGLGGALSGSGQTGADD172 pKa = 3.6LSTGFQAATEE182 pKa = 4.24TFADD186 pKa = 3.57AGANLSTGIEE196 pKa = 3.97AGINAATTGLADD208 pKa = 3.97ASTGLTAGVSGLNAEE223 pKa = 4.6LNGALGGAAEE233 pKa = 4.54AGAGLGAEE241 pKa = 4.6LGGALGGAAAAGAGLGAGLGGALGSVAQAGAGVGAGLSGALNGAAQAGAGLGGALGAVAGDD302 pKa = 3.89GAGLGAEE309 pKa = 4.56LGGALGGAAAAGAGLGAGLGGAAQAGAGLGAQLGGALGGAAEE351 pKa = 4.54AGAGLGAEE359 pKa = 4.53LGGASSGAAQAGAGLGAHH377 pKa = 7.18DD378 pKa = 5.53AGDD381 pKa = 4.23LSASLSGGATAGVQSAGDD399 pKa = 3.49VSGTLSGVAGSGLRR413 pKa = 11.84SVGDD417 pKa = 3.54LSGDD421 pKa = 3.32AAAGVHH427 pKa = 5.66SAGDD431 pKa = 3.5VSSALSGTGASGLEE445 pKa = 4.16SGLGSAGSLSSSLSGSADD463 pKa = 3.48SALHH467 pKa = 6.06TGTEE471 pKa = 4.3VSAGLSGLGTNLSGSADD488 pKa = 3.7SGVHH492 pKa = 5.85GGTDD496 pKa = 3.31VSSALSDD503 pKa = 3.36TASAGLHH510 pKa = 5.58GAGEE514 pKa = 4.37VSSAVSGTVGGDD526 pKa = 3.16LGSVDD531 pKa = 3.6SAATHH536 pKa = 5.9GLGVDD541 pKa = 3.8SSVGTPVSGTWSGVDD556 pKa = 3.34VSHH559 pKa = 7.35AFGSGVGADD568 pKa = 3.4LSGNFGGTGSGIDD581 pKa = 3.44SALSAGGHH589 pKa = 5.92GALDD593 pKa = 3.62SGIDD597 pKa = 3.72TSGHH601 pKa = 5.14TDD603 pKa = 2.83AGLFGDD609 pKa = 4.14THH611 pKa = 5.71TTTVTDD617 pKa = 3.1THH619 pKa = 6.36VAGDD623 pKa = 3.63VTGGLLHH630 pKa = 7.18
MM1 pKa = 7.2TPNAILEE8 pKa = 4.76FILDD12 pKa = 4.13LLRR15 pKa = 11.84DD16 pKa = 3.52HH17 pKa = 6.87EE18 pKa = 4.38AAVGYY23 pKa = 8.81CANPAEE29 pKa = 4.5SLCAAGLTAVTPEE42 pKa = 5.11DD43 pKa = 3.51IAAVAPMVAEE53 pKa = 4.18SALVSGGSQLAAIVAAGGGASGTAGLAGGAATTTEE88 pKa = 4.27ANLGTGAALGAATGIAAGTGLDD110 pKa = 3.64LGAGLGLGANAGIGGDD126 pKa = 3.74LGAGLGAAAAVGAGLEE142 pKa = 4.21AGLTAGLGALTGVAVGLGGALSGSGQTGADD172 pKa = 3.6LSTGFQAATEE182 pKa = 4.24TFADD186 pKa = 3.57AGANLSTGIEE196 pKa = 3.97AGINAATTGLADD208 pKa = 3.97ASTGLTAGVSGLNAEE223 pKa = 4.6LNGALGGAAEE233 pKa = 4.54AGAGLGAEE241 pKa = 4.6LGGALGGAAAAGAGLGAGLGGALGSVAQAGAGVGAGLSGALNGAAQAGAGLGGALGAVAGDD302 pKa = 3.89GAGLGAEE309 pKa = 4.56LGGALGGAAAAGAGLGAGLGGAAQAGAGLGAQLGGALGGAAEE351 pKa = 4.54AGAGLGAEE359 pKa = 4.53LGGASSGAAQAGAGLGAHH377 pKa = 7.18DD378 pKa = 5.53AGDD381 pKa = 4.23LSASLSGGATAGVQSAGDD399 pKa = 3.49VSGTLSGVAGSGLRR413 pKa = 11.84SVGDD417 pKa = 3.54LSGDD421 pKa = 3.32AAAGVHH427 pKa = 5.66SAGDD431 pKa = 3.5VSSALSGTGASGLEE445 pKa = 4.16SGLGSAGSLSSSLSGSADD463 pKa = 3.48SALHH467 pKa = 6.06TGTEE471 pKa = 4.3VSAGLSGLGTNLSGSADD488 pKa = 3.7SGVHH492 pKa = 5.85GGTDD496 pKa = 3.31VSSALSDD503 pKa = 3.36TASAGLHH510 pKa = 5.58GAGEE514 pKa = 4.37VSSAVSGTVGGDD526 pKa = 3.16LGSVDD531 pKa = 3.6SAATHH536 pKa = 5.9GLGVDD541 pKa = 3.8SSVGTPVSGTWSGVDD556 pKa = 3.34VSHH559 pKa = 7.35AFGSGVGADD568 pKa = 3.4LSGNFGGTGSGIDD581 pKa = 3.44SALSAGGHH589 pKa = 5.92GALDD593 pKa = 3.62SGIDD597 pKa = 3.72TSGHH601 pKa = 5.14TDD603 pKa = 2.83AGLFGDD609 pKa = 4.14THH611 pKa = 5.71TTTVTDD617 pKa = 3.1THH619 pKa = 6.36VAGDD623 pKa = 3.63VTGGLLHH630 pKa = 7.18
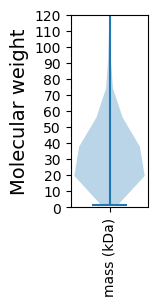
Molecular weight: 54.79 kDa
Isoelectric point according different methods:
Protein with the highest isoelectric point:
>tr|W5T6I0|W5T6I0_9NOCA Superoxide dismutase OS=Nocardia nova SH22a OX=1415166 GN=sodA PE=3 SV=1
MM1 pKa = 7.69AKK3 pKa = 10.06GKK5 pKa = 8.69RR6 pKa = 11.84TFQPNNRR13 pKa = 11.84RR14 pKa = 11.84RR15 pKa = 11.84ARR17 pKa = 11.84VHH19 pKa = 5.99GFRR22 pKa = 11.84LRR24 pKa = 11.84MRR26 pKa = 11.84TRR28 pKa = 11.84AGRR31 pKa = 11.84AIVSARR37 pKa = 11.84RR38 pKa = 11.84RR39 pKa = 11.84KK40 pKa = 9.72GRR42 pKa = 11.84ASLTAA47 pKa = 4.1
MM1 pKa = 7.69AKK3 pKa = 10.06GKK5 pKa = 8.69RR6 pKa = 11.84TFQPNNRR13 pKa = 11.84RR14 pKa = 11.84RR15 pKa = 11.84ARR17 pKa = 11.84VHH19 pKa = 5.99GFRR22 pKa = 11.84LRR24 pKa = 11.84MRR26 pKa = 11.84TRR28 pKa = 11.84AGRR31 pKa = 11.84AIVSARR37 pKa = 11.84RR38 pKa = 11.84RR39 pKa = 11.84KK40 pKa = 9.72GRR42 pKa = 11.84ASLTAA47 pKa = 4.1
Molecular weight: 5.48 kDa
Isoelectric point according different methods:
Peptides (in silico digests for buttom-up proteomics)
Below you can find in silico digests of the whole proteome with Trypsin, Chymotrypsin, Trypsin+LysC, LysN, ArgC proteases suitable for different mass spec machines.| Try ESI |
 |
|---|
| ChTry ESI |
 |
|---|
| ArgC ESI |
 |
|---|
| LysN ESI |
 |
|---|
| TryLysC ESI |
 |
|---|
| Try MALDI |
 |
|---|
| ChTry MALDI |
 |
|---|
| ArgC MALDI |
 |
|---|
| LysN MALDI |
 |
|---|
| TryLysC MALDI |
 |
|---|
| Try LTQ |
 |
|---|
| ChTry LTQ |
 |
|---|
| ArgC LTQ |
 |
|---|
| LysN LTQ |
 |
|---|
| TryLysC LTQ |
 |
|---|
| Try MSlow |
 |
|---|
| ChTry MSlow |
 |
|---|
| ArgC MSlow |
 |
|---|
| LysN MSlow |
 |
|---|
| TryLysC MSlow |
 |
|---|
| Try MShigh |
 |
|---|
| ChTry MShigh |
 |
|---|
| ArgC MShigh |
 |
|---|
| LysN MShigh |
 |
|---|
| TryLysC MShigh |
 |
|---|
General Statistics
Number of major isoforms |
Number of additional isoforms |
Number of all proteins |
Number of amino acids |
Min. Seq. Length |
Max. Seq. Length |
Avg. Seq. Length |
Avg. Mol. Weight |
|---|---|---|---|---|---|---|---|
0 |
2480242 |
12 |
16761 |
327.3 |
35.12 |
Amino acid frequency
Ala |
Cys |
Asp |
Glu |
Phe |
Gly |
His |
Ile |
Lys |
Leu |
|---|---|---|---|---|---|---|---|---|---|
13.331 ± 0.04 | 0.772 ± 0.01 |
6.375 ± 0.025 | 5.383 ± 0.029 |
2.933 ± 0.016 | 9.034 ± 0.028 |
2.281 ± 0.013 | 4.214 ± 0.016 |
1.819 ± 0.021 | 9.791 ± 0.029 |
Met |
Asn |
Gln |
Pro |
Arg |
Ser |
Thr |
Val |
Trp |
Tyr |
|---|---|---|---|---|---|---|---|---|---|
1.92 ± 0.012 | 1.99 ± 0.016 |
5.995 ± 0.027 | 2.799 ± 0.017 |
7.918 ± 0.029 | 5.308 ± 0.02 |
6.192 ± 0.016 | 8.406 ± 0.03 |
1.463 ± 0.012 | 2.076 ± 0.012 |
Most of the basic statistics you can see at this page can be downloaded from this CSV file
Proteome-pI is available under Creative Commons Attribution-NoDerivs license, for more details see here
| Reference: Kozlowski LP. Proteome-pI 2.0: Proteome Isoelectric Point Database Update. Nucleic Acids Res. 2021, doi: 10.1093/nar/gkab944 | Contact: Lukasz P. Kozlowski |
