Reticulomyxa filosa
Taxonomy: cellular organisms; Eukaryota; Sar; Rhizaria; Retaria; Foraminifera; Monothalamids; Reticulomyxidae; Reticulomyxa
Average proteome isoelectric point is 7.08
Get precalculated fractions of proteins

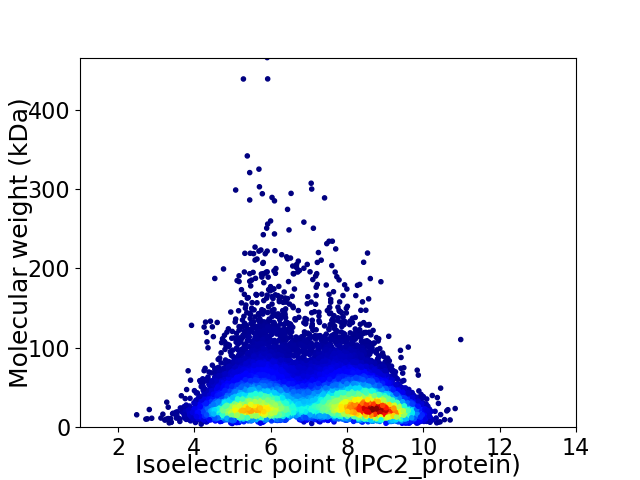
Virtual 2D-PAGE plot for 39903 proteins (isoelectric point calculated using IPC2_protein)
Get csv file with sequences according to given criteria:
* You can choose from 21 different methods for calculating isoelectric point
Summary statistics related to proteome-wise predictions


Protein with the lowest isoelectric point:
>tr|X6N2F8|X6N2F8_RETFI Uncharacterized protein OS=Reticulomyxa filosa OX=46433 GN=RFI_16941 PE=4 SV=1
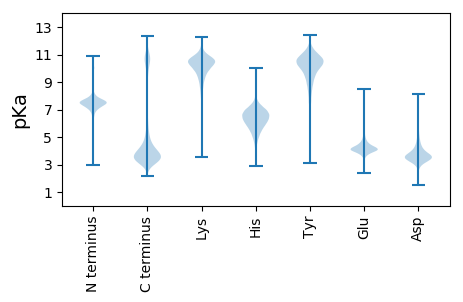
MM1 pKa = 7.37LVDD4 pKa = 3.59TTEE7 pKa = 4.05SPEE10 pKa = 4.36YY11 pKa = 10.62DD12 pKa = 4.57DD13 pKa = 6.2NDD15 pKa = 4.42DD16 pKa = 4.08NDD18 pKa = 4.64DD19 pKa = 3.75VFISTKK25 pKa = 8.06TTDD28 pKa = 3.23EE29 pKa = 4.66GEE31 pKa = 4.56GEE33 pKa = 4.21SSEE36 pKa = 4.75EE37 pKa = 3.99YY38 pKa = 10.76LDD40 pKa = 3.92STSLDD45 pKa = 3.14IDD47 pKa = 3.48TTAATNASWPLDD59 pKa = 2.88WWEE62 pKa = 3.84EE63 pKa = 4.0FIPEE67 pKa = 4.31GFAFTFSLGLEE78 pKa = 4.19GCYY81 pKa = 9.93GVCEE85 pKa = 4.04GVGLGLIWDD94 pKa = 4.04VANQRR99 pKa = 11.84MFLSLDD105 pKa = 3.91SILLGINYY113 pKa = 9.46QKK115 pKa = 10.72GVHH118 pKa = 5.41VFAEE122 pKa = 4.45TGFLLLEE129 pKa = 4.97DD130 pKa = 3.45KK131 pKa = 10.99HH132 pKa = 6.0LTNTYY137 pKa = 10.75LDD139 pKa = 4.73LGWQFDD145 pKa = 3.68LWEE148 pKa = 4.68DD149 pKa = 3.59ANTSVNAVQVNVMWNLGHH167 pKa = 6.42DD168 pKa = 4.11TKK170 pKa = 11.25LLPCGLTLRR179 pKa = 11.84YY180 pKa = 10.18DD181 pKa = 3.2IFGVGSEE188 pKa = 4.47EE189 pKa = 4.42WPCHH193 pKa = 5.65KK194 pKa = 10.47PYY196 pKa = 10.71DD197 pKa = 4.13SPEE200 pKa = 4.12LLDD203 pKa = 4.25EE204 pKa = 5.11GNVSLPAPQLPTNEE218 pKa = 4.32TVSLITTSLNQGTEE232 pKa = 3.53IFSNDD237 pKa = 3.2TQEE240 pKa = 4.33EE241 pKa = 4.86EE242 pKa = 4.33EE243 pKa = 5.01GSTPTQAEE251 pKa = 4.32LMTTVAEE258 pKa = 4.24SLPNGSVSQPPTTPNLTAVEE278 pKa = 4.54EE279 pKa = 4.62GQSTDD284 pKa = 3.71LPSEE288 pKa = 4.24FPLTSIIDD296 pKa = 3.73LPPWFEE302 pKa = 3.93APYY305 pKa = 10.56CEE307 pKa = 4.21GFRR310 pKa = 11.84VSLRR314 pKa = 11.84RR315 pKa = 11.84KK316 pKa = 9.45KK317 pKa = 10.62VLAKK321 pKa = 9.15MDD323 pKa = 4.13CYY325 pKa = 11.42
MM1 pKa = 7.37LVDD4 pKa = 3.59TTEE7 pKa = 4.05SPEE10 pKa = 4.36YY11 pKa = 10.62DD12 pKa = 4.57DD13 pKa = 6.2NDD15 pKa = 4.42DD16 pKa = 4.08NDD18 pKa = 4.64DD19 pKa = 3.75VFISTKK25 pKa = 8.06TTDD28 pKa = 3.23EE29 pKa = 4.66GEE31 pKa = 4.56GEE33 pKa = 4.21SSEE36 pKa = 4.75EE37 pKa = 3.99YY38 pKa = 10.76LDD40 pKa = 3.92STSLDD45 pKa = 3.14IDD47 pKa = 3.48TTAATNASWPLDD59 pKa = 2.88WWEE62 pKa = 3.84EE63 pKa = 4.0FIPEE67 pKa = 4.31GFAFTFSLGLEE78 pKa = 4.19GCYY81 pKa = 9.93GVCEE85 pKa = 4.04GVGLGLIWDD94 pKa = 4.04VANQRR99 pKa = 11.84MFLSLDD105 pKa = 3.91SILLGINYY113 pKa = 9.46QKK115 pKa = 10.72GVHH118 pKa = 5.41VFAEE122 pKa = 4.45TGFLLLEE129 pKa = 4.97DD130 pKa = 3.45KK131 pKa = 10.99HH132 pKa = 6.0LTNTYY137 pKa = 10.75LDD139 pKa = 4.73LGWQFDD145 pKa = 3.68LWEE148 pKa = 4.68DD149 pKa = 3.59ANTSVNAVQVNVMWNLGHH167 pKa = 6.42DD168 pKa = 4.11TKK170 pKa = 11.25LLPCGLTLRR179 pKa = 11.84YY180 pKa = 10.18DD181 pKa = 3.2IFGVGSEE188 pKa = 4.47EE189 pKa = 4.42WPCHH193 pKa = 5.65KK194 pKa = 10.47PYY196 pKa = 10.71DD197 pKa = 4.13SPEE200 pKa = 4.12LLDD203 pKa = 4.25EE204 pKa = 5.11GNVSLPAPQLPTNEE218 pKa = 4.32TVSLITTSLNQGTEE232 pKa = 3.53IFSNDD237 pKa = 3.2TQEE240 pKa = 4.33EE241 pKa = 4.86EE242 pKa = 4.33EE243 pKa = 5.01GSTPTQAEE251 pKa = 4.32LMTTVAEE258 pKa = 4.24SLPNGSVSQPPTTPNLTAVEE278 pKa = 4.54EE279 pKa = 4.62GQSTDD284 pKa = 3.71LPSEE288 pKa = 4.24FPLTSIIDD296 pKa = 3.73LPPWFEE302 pKa = 3.93APYY305 pKa = 10.56CEE307 pKa = 4.21GFRR310 pKa = 11.84VSLRR314 pKa = 11.84RR315 pKa = 11.84KK316 pKa = 9.45KK317 pKa = 10.62VLAKK321 pKa = 9.15MDD323 pKa = 4.13CYY325 pKa = 11.42
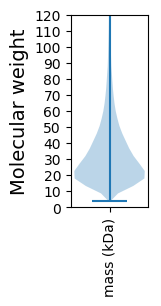
Molecular weight: 36.07 kDa
Isoelectric point according different methods:
Protein with the highest isoelectric point:
>tr|X6L8J3|X6L8J3_RETFI Uncharacterized protein (Fragment) OS=Reticulomyxa filosa OX=46433 GN=RFI_39203 PE=4 SV=1
GG1 pKa = 7.23RR2 pKa = 11.84FVGLFVGILVGFLVGKK18 pKa = 9.54FVGLLVGTFVGLFVGRR34 pKa = 11.84FVGLFVGTLVGLFVGTVVGLLVGTFVGLFVGTLVGLFVGILVGLLVGTLVGLFVGTLVGLLVGTFVGLFVGRR106 pKa = 11.84LVGLLVGTLVGLFVGILVGLFVGTLVGLFVGILVGLLVGTLVGLLVGTLVGLLVGTFVGLFVGRR170 pKa = 11.84LVGLLVGTLVGLFVGTLVGLFVGIFVGLLVGTFVGLFVGSLVVGLLVGTLVGLFVGTFVGLFVGRR235 pKa = 11.84LL236 pKa = 3.33
GG1 pKa = 7.23RR2 pKa = 11.84FVGLFVGILVGFLVGKK18 pKa = 9.54FVGLLVGTFVGLFVGRR34 pKa = 11.84FVGLFVGTLVGLFVGTVVGLLVGTFVGLFVGTLVGLFVGILVGLLVGTLVGLFVGTLVGLLVGTFVGLFVGRR106 pKa = 11.84LVGLLVGTLVGLFVGILVGLFVGTLVGLFVGILVGLLVGTLVGLLVGTLVGLLVGTFVGLFVGRR170 pKa = 11.84LVGLLVGTLVGLFVGTLVGLFVGIFVGLLVGTFVGLFVGSLVVGLLVGTLVGLFVGTFVGLFVGRR235 pKa = 11.84LL236 pKa = 3.33
Molecular weight: 23.51 kDa
Isoelectric point according different methods:
Peptides (in silico digests for buttom-up proteomics)
Below you can find in silico digests of the whole proteome with Trypsin, Chymotrypsin, Trypsin+LysC, LysN, ArgC proteases suitable for different mass spec machines.| Try ESI |
 |
|---|
| ChTry ESI |
 |
|---|
| ArgC ESI |
 |
|---|
| LysN ESI |
 |
|---|
| TryLysC ESI |
 |
|---|
| Try MALDI |
 |
|---|
| ChTry MALDI |
 |
|---|
| ArgC MALDI |
 |
|---|
| LysN MALDI |
 |
|---|
| TryLysC MALDI |
 |
|---|
| Try LTQ |
 |
|---|
| ChTry LTQ |
 |
|---|
| ArgC LTQ |
 |
|---|
| LysN LTQ |
 |
|---|
| TryLysC LTQ |
 |
|---|
| Try MSlow |
 |
|---|
| ChTry MSlow |
 |
|---|
| ArgC MSlow |
 |
|---|
| LysN MSlow |
 |
|---|
| TryLysC MSlow |
 |
|---|
| Try MShigh |
 |
|---|
| ChTry MShigh |
 |
|---|
| ArgC MShigh |
 |
|---|
| LysN MShigh |
 |
|---|
| TryLysC MShigh |
 |
|---|
General Statistics
Number of major isoforms |
Number of additional isoforms |
Number of all proteins |
Number of amino acids |
Min. Seq. Length |
Max. Seq. Length |
Avg. Seq. Length |
Avg. Mol. Weight |
|---|---|---|---|---|---|---|---|
0 |
12687417 |
33 |
4041 |
318.0 |
36.61 |
Amino acid frequency
Ala |
Cys |
Asp |
Glu |
Phe |
Gly |
His |
Ile |
Lys |
Leu |
|---|---|---|---|---|---|---|---|---|---|
4.668 ± 0.011 | 2.069 ± 0.007 |
5.563 ± 0.01 | 6.624 ± 0.016 |
4.909 ± 0.01 | 4.277 ± 0.012 |
2.769 ± 0.008 | 6.6 ± 0.015 |
8.779 ± 0.019 | 8.852 ± 0.014 |
Met |
Asn |
Gln |
Pro |
Arg |
Ser |
Thr |
Val |
Trp |
Tyr |
|---|---|---|---|---|---|---|---|---|---|
2.33 ± 0.006 | 6.864 ± 0.016 |
3.232 ± 0.009 | 4.886 ± 0.011 |
4.175 ± 0.009 | 7.689 ± 0.014 |
5.559 ± 0.011 | 5.489 ± 0.01 |
1.297 ± 0.005 | 3.369 ± 0.008 |
Most of the basic statistics you can see at this page can be downloaded from this CSV file
Proteome-pI is available under Creative Commons Attribution-NoDerivs license, for more details see here
| Reference: Kozlowski LP. Proteome-pI 2.0: Proteome Isoelectric Point Database Update. Nucleic Acids Res. 2021, doi: 10.1093/nar/gkab944 | Contact: Lukasz P. Kozlowski |
