Flavobacterium sp.
Taxonomy: cellular organisms; Bacteria; FCB group; Bacteroidetes/Chlorobi group; Bacteroidetes; Flavobacteriia; Flavobacteriales; Flavobacteriaceae; Flavobacterium; unclassified Flavobacterium
Average proteome isoelectric point is 6.57
Get precalculated fractions of proteins

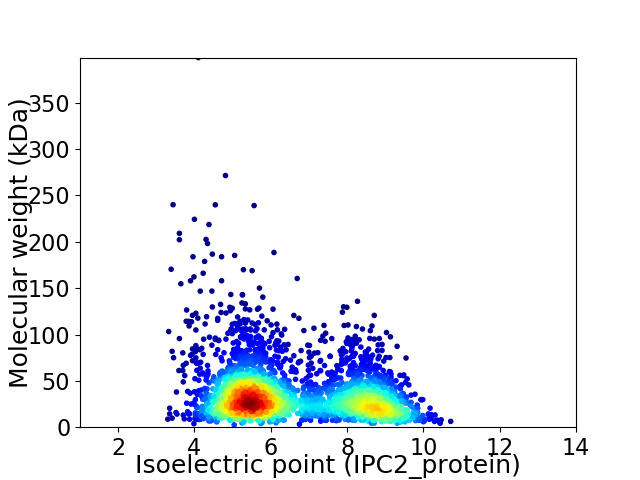
Virtual 2D-PAGE plot for 3029 proteins (isoelectric point calculated using IPC2_protein)
Get csv file with sequences according to given criteria:
* You can choose from 21 different methods for calculating isoelectric point
Summary statistics related to proteome-wise predictions


Protein with the lowest isoelectric point:
>tr|A0A519KHE1|A0A519KHE1_FLASP XRE family transcriptional regulator OS=Flavobacterium sp. OX=239 GN=EOO51_01425 PE=4 SV=1
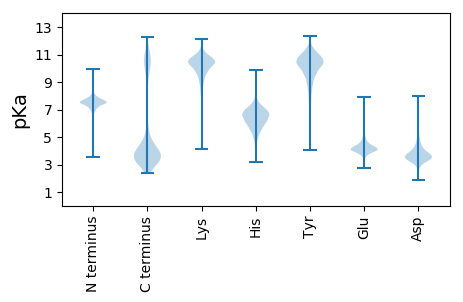
MM1 pKa = 6.96KK2 pKa = 9.71TLRR5 pKa = 11.84TSILAMLAIFAVSCSTDD22 pKa = 3.26DD23 pKa = 3.51VEE25 pKa = 4.86NRR27 pKa = 11.84PIVEE31 pKa = 4.43AGDD34 pKa = 3.78AAVLTAPEE42 pKa = 4.2EE43 pKa = 4.39GNVYY47 pKa = 10.78VLTPEE52 pKa = 4.31NMDD55 pKa = 3.55ALGEE59 pKa = 4.23RR60 pKa = 11.84FVWTAANFGAGVIPNYY76 pKa = 10.38AIEE79 pKa = 4.28IDD81 pKa = 3.55RR82 pKa = 11.84AGDD85 pKa = 3.65NFDD88 pKa = 3.61TPATIGITNGTTQFAASQSVLNTALLAVGAVPYY121 pKa = 10.25EE122 pKa = 4.08SANFEE127 pKa = 4.41VRR129 pKa = 11.84VKK131 pKa = 10.85AYY133 pKa = 10.35VGDD136 pKa = 3.62MFNYY140 pKa = 10.18SNVAEE145 pKa = 4.6MIITPYY151 pKa = 8.05TTEE154 pKa = 3.8TPKK157 pKa = 10.3IYY159 pKa = 10.65AVGNFQAASGYY170 pKa = 10.38GNDD173 pKa = 3.36WTPADD178 pKa = 4.01GVPLEE183 pKa = 4.23SSGFGLTDD191 pKa = 3.68FEE193 pKa = 5.56GYY195 pKa = 11.11VYY197 pKa = 10.45MNVPTPEE204 pKa = 4.12FKK206 pKa = 10.93LLPTNEE212 pKa = 4.13NFDD215 pKa = 4.01GDD217 pKa = 4.04FGDD220 pKa = 4.91DD221 pKa = 3.36GSFAGMLTQSGAGEE235 pKa = 4.09ANIPLSGPGYY245 pKa = 10.57YY246 pKa = 10.25LIKK249 pKa = 10.74ANTGAVTASNPEE261 pKa = 3.6GMTYY265 pKa = 9.15TAQPTAWGIIGSATPTGWDD284 pKa = 3.21SDD286 pKa = 3.36TDD288 pKa = 3.71MTYY291 pKa = 11.28DD292 pKa = 3.76PATKK296 pKa = 9.95KK297 pKa = 7.24WTITLNLIGGQEE309 pKa = 3.77IKK311 pKa = 10.7FRR313 pKa = 11.84ANDD316 pKa = 3.14AWDD319 pKa = 4.3LNFGDD324 pKa = 5.35DD325 pKa = 3.77GANGSLEE332 pKa = 4.14AGGANIAIPTSGSYY346 pKa = 8.89TVTLDD351 pKa = 3.61LSNPRR356 pKa = 11.84QYY358 pKa = 10.72TYY360 pKa = 11.45SVTANN365 pKa = 3.23
MM1 pKa = 6.96KK2 pKa = 9.71TLRR5 pKa = 11.84TSILAMLAIFAVSCSTDD22 pKa = 3.26DD23 pKa = 3.51VEE25 pKa = 4.86NRR27 pKa = 11.84PIVEE31 pKa = 4.43AGDD34 pKa = 3.78AAVLTAPEE42 pKa = 4.2EE43 pKa = 4.39GNVYY47 pKa = 10.78VLTPEE52 pKa = 4.31NMDD55 pKa = 3.55ALGEE59 pKa = 4.23RR60 pKa = 11.84FVWTAANFGAGVIPNYY76 pKa = 10.38AIEE79 pKa = 4.28IDD81 pKa = 3.55RR82 pKa = 11.84AGDD85 pKa = 3.65NFDD88 pKa = 3.61TPATIGITNGTTQFAASQSVLNTALLAVGAVPYY121 pKa = 10.25EE122 pKa = 4.08SANFEE127 pKa = 4.41VRR129 pKa = 11.84VKK131 pKa = 10.85AYY133 pKa = 10.35VGDD136 pKa = 3.62MFNYY140 pKa = 10.18SNVAEE145 pKa = 4.6MIITPYY151 pKa = 8.05TTEE154 pKa = 3.8TPKK157 pKa = 10.3IYY159 pKa = 10.65AVGNFQAASGYY170 pKa = 10.38GNDD173 pKa = 3.36WTPADD178 pKa = 4.01GVPLEE183 pKa = 4.23SSGFGLTDD191 pKa = 3.68FEE193 pKa = 5.56GYY195 pKa = 11.11VYY197 pKa = 10.45MNVPTPEE204 pKa = 4.12FKK206 pKa = 10.93LLPTNEE212 pKa = 4.13NFDD215 pKa = 4.01GDD217 pKa = 4.04FGDD220 pKa = 4.91DD221 pKa = 3.36GSFAGMLTQSGAGEE235 pKa = 4.09ANIPLSGPGYY245 pKa = 10.57YY246 pKa = 10.25LIKK249 pKa = 10.74ANTGAVTASNPEE261 pKa = 3.6GMTYY265 pKa = 9.15TAQPTAWGIIGSATPTGWDD284 pKa = 3.21SDD286 pKa = 3.36TDD288 pKa = 3.71MTYY291 pKa = 11.28DD292 pKa = 3.76PATKK296 pKa = 9.95KK297 pKa = 7.24WTITLNLIGGQEE309 pKa = 3.77IKK311 pKa = 10.7FRR313 pKa = 11.84ANDD316 pKa = 3.14AWDD319 pKa = 4.3LNFGDD324 pKa = 5.35DD325 pKa = 3.77GANGSLEE332 pKa = 4.14AGGANIAIPTSGSYY346 pKa = 8.89TVTLDD351 pKa = 3.61LSNPRR356 pKa = 11.84QYY358 pKa = 10.72TYY360 pKa = 11.45SVTANN365 pKa = 3.23
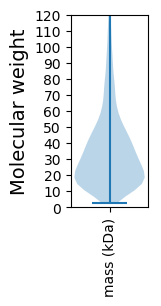
Molecular weight: 38.61 kDa
Isoelectric point according different methods:
Protein with the highest isoelectric point:
>tr|A0A519K7U0|A0A519K7U0_FLASP T9SS type A sorting domain-containing protein (Fragment) OS=Flavobacterium sp. OX=239 GN=EOO51_15005 PE=4 SV=1
MM1 pKa = 7.69SKK3 pKa = 9.01RR4 pKa = 11.84TFQPSKK10 pKa = 9.13RR11 pKa = 11.84KK12 pKa = 9.48RR13 pKa = 11.84RR14 pKa = 11.84NKK16 pKa = 9.91HH17 pKa = 4.39GFMDD21 pKa = 4.5RR22 pKa = 11.84MASANGRR29 pKa = 11.84KK30 pKa = 9.04VLARR34 pKa = 11.84RR35 pKa = 11.84RR36 pKa = 11.84AKK38 pKa = 10.19GRR40 pKa = 11.84HH41 pKa = 5.41KK42 pKa = 10.14LTVSSEE48 pKa = 3.92PRR50 pKa = 11.84HH51 pKa = 5.77KK52 pKa = 10.61KK53 pKa = 9.84
MM1 pKa = 7.69SKK3 pKa = 9.01RR4 pKa = 11.84TFQPSKK10 pKa = 9.13RR11 pKa = 11.84KK12 pKa = 9.48RR13 pKa = 11.84RR14 pKa = 11.84NKK16 pKa = 9.91HH17 pKa = 4.39GFMDD21 pKa = 4.5RR22 pKa = 11.84MASANGRR29 pKa = 11.84KK30 pKa = 9.04VLARR34 pKa = 11.84RR35 pKa = 11.84RR36 pKa = 11.84AKK38 pKa = 10.19GRR40 pKa = 11.84HH41 pKa = 5.41KK42 pKa = 10.14LTVSSEE48 pKa = 3.92PRR50 pKa = 11.84HH51 pKa = 5.77KK52 pKa = 10.61KK53 pKa = 9.84
Molecular weight: 6.3 kDa
Isoelectric point according different methods:
Peptides (in silico digests for buttom-up proteomics)
Below you can find in silico digests of the whole proteome with Trypsin, Chymotrypsin, Trypsin+LysC, LysN, ArgC proteases suitable for different mass spec machines.| Try ESI |
 |
|---|
| ChTry ESI |
 |
|---|
| ArgC ESI |
 |
|---|
| LysN ESI |
 |
|---|
| TryLysC ESI |
 |
|---|
| Try MALDI |
 |
|---|
| ChTry MALDI |
 |
|---|
| ArgC MALDI |
 |
|---|
| LysN MALDI |
 |
|---|
| TryLysC MALDI |
 |
|---|
| Try LTQ |
 |
|---|
| ChTry LTQ |
 |
|---|
| ArgC LTQ |
 |
|---|
| LysN LTQ |
 |
|---|
| TryLysC LTQ |
 |
|---|
| Try MSlow |
 |
|---|
| ChTry MSlow |
 |
|---|
| ArgC MSlow |
 |
|---|
| LysN MSlow |
 |
|---|
| TryLysC MSlow |
 |
|---|
| Try MShigh |
 |
|---|
| ChTry MShigh |
 |
|---|
| ArgC MShigh |
 |
|---|
| LysN MShigh |
 |
|---|
| TryLysC MShigh |
 |
|---|
General Statistics
Number of major isoforms |
Number of additional isoforms |
Number of all proteins |
Number of amino acids |
Min. Seq. Length |
Max. Seq. Length |
Avg. Seq. Length |
Avg. Mol. Weight |
|---|---|---|---|---|---|---|---|
0 |
1023528 |
21 |
3895 |
337.9 |
37.75 |
Amino acid frequency
Ala |
Cys |
Asp |
Glu |
Phe |
Gly |
His |
Ile |
Lys |
Leu |
|---|---|---|---|---|---|---|---|---|---|
7.568 ± 0.045 | 0.862 ± 0.018 |
5.526 ± 0.037 | 5.961 ± 0.066 |
5.098 ± 0.033 | 6.78 ± 0.053 |
1.764 ± 0.025 | 7.326 ± 0.04 |
6.509 ± 0.072 | 8.861 ± 0.05 |
Met |
Asn |
Gln |
Pro |
Arg |
Ser |
Thr |
Val |
Trp |
Tyr |
|---|---|---|---|---|---|---|---|---|---|
2.316 ± 0.025 | 5.706 ± 0.046 |
3.835 ± 0.038 | 3.435 ± 0.025 |
4.125 ± 0.041 | 6.768 ± 0.055 |
6.154 ± 0.086 | 6.546 ± 0.037 |
1.001 ± 0.018 | 3.858 ± 0.029 |
Most of the basic statistics you can see at this page can be downloaded from this CSV file
Proteome-pI is available under Creative Commons Attribution-NoDerivs license, for more details see here
| Reference: Kozlowski LP. Proteome-pI 2.0: Proteome Isoelectric Point Database Update. Nucleic Acids Res. 2021, doi: 10.1093/nar/gkab944 | Contact: Lukasz P. Kozlowski |
