candidate division MSBL1 archaeon SCGC-AAA259I07
Taxonomy: cellular organisms; Archaea; Euryarchaeota; Euryarchaeota incertae sedis; candidate division MSBL1
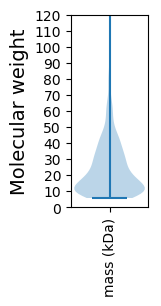
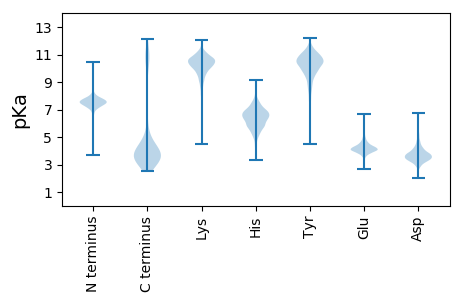
Average proteome isoelectric point is 6.2
Get precalculated fractions of proteins

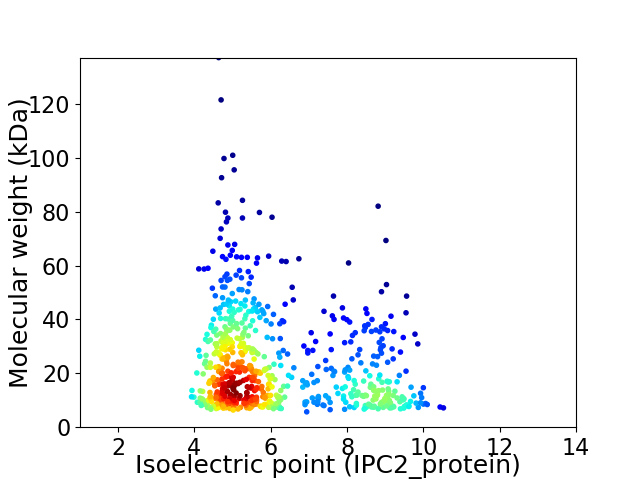
Virtual 2D-PAGE plot for 671 proteins (isoelectric point calculated using IPC2_protein)
Get csv file with sequences according to given criteria:
* You can choose from 21 different methods for calculating isoelectric point
Summary statistics related to proteome-wise predictions


Protein with the lowest isoelectric point:
>tr|A0A133UMZ8|A0A133UMZ8_9EURY Uncharacterized protein OS=candidate division MSBL1 archaeon SCGC-AAA259I07 OX=1698266 GN=AKJ36_00395 PE=4 SV=1
MM1 pKa = 7.05ITLDD5 pKa = 4.05KK6 pKa = 10.34KK7 pKa = 10.64AQGSTEE13 pKa = 3.87YY14 pKa = 10.29MLILAVVLVVAGAIYY29 pKa = 9.84FITRR33 pKa = 11.84SGGNYY38 pKa = 8.29PAVSATPVAKK48 pKa = 10.3DD49 pKa = 3.56ANNDD53 pKa = 3.29GSDD56 pKa = 3.61DD57 pKa = 4.01LVILVEE63 pKa = 4.44ANSIPSGEE71 pKa = 4.02WKK73 pKa = 10.27VVYY76 pKa = 10.58NGTTVSPDD84 pKa = 3.21EE85 pKa = 4.67PLEE88 pKa = 3.98QPQYY92 pKa = 10.94IVDD95 pKa = 3.92DD96 pKa = 5.13NIPEE100 pKa = 4.02DD101 pKa = 3.93TYY103 pKa = 11.69EE104 pKa = 4.12VTLSHH109 pKa = 6.73IPSGHH114 pKa = 5.68VYY116 pKa = 9.3FNEE119 pKa = 5.08RR120 pKa = 11.84ITIQQ124 pKa = 3.06
MM1 pKa = 7.05ITLDD5 pKa = 4.05KK6 pKa = 10.34KK7 pKa = 10.64AQGSTEE13 pKa = 3.87YY14 pKa = 10.29MLILAVVLVVAGAIYY29 pKa = 9.84FITRR33 pKa = 11.84SGGNYY38 pKa = 8.29PAVSATPVAKK48 pKa = 10.3DD49 pKa = 3.56ANNDD53 pKa = 3.29GSDD56 pKa = 3.61DD57 pKa = 4.01LVILVEE63 pKa = 4.44ANSIPSGEE71 pKa = 4.02WKK73 pKa = 10.27VVYY76 pKa = 10.58NGTTVSPDD84 pKa = 3.21EE85 pKa = 4.67PLEE88 pKa = 3.98QPQYY92 pKa = 10.94IVDD95 pKa = 3.92DD96 pKa = 5.13NIPEE100 pKa = 4.02DD101 pKa = 3.93TYY103 pKa = 11.69EE104 pKa = 4.12VTLSHH109 pKa = 6.73IPSGHH114 pKa = 5.68VYY116 pKa = 9.3FNEE119 pKa = 5.08RR120 pKa = 11.84ITIQQ124 pKa = 3.06
Molecular weight: 13.49 kDa
Isoelectric point according different methods:
Protein with the highest isoelectric point:
>tr|A0A133ULR6|A0A133ULR6_9EURY Nucleic acid-binding protein OS=candidate division MSBL1 archaeon SCGC-AAA259I07 OX=1698266 GN=AKJ36_01360 PE=4 SV=1
MM1 pKa = 6.98GCARR5 pKa = 11.84VKK7 pKa = 10.44GAQQSLSARR16 pKa = 11.84LQRR19 pKa = 11.84EE20 pKa = 3.81CRR22 pKa = 11.84AIARR26 pKa = 11.84FLVGANEE33 pKa = 4.16MADD36 pKa = 3.21IFPPHH41 pKa = 6.58LSGVNEE47 pKa = 4.01MKK49 pKa = 10.78LGGGFAFRR57 pKa = 11.84PHH59 pKa = 6.97KK60 pKa = 10.5PPIRR64 pKa = 11.84YY65 pKa = 8.75ILCLIFQFSFQQLTSSLLFNRR86 pKa = 11.84ALVLVQLAKK95 pKa = 10.24EE96 pKa = 4.1LPSFVRR102 pKa = 11.84KK103 pKa = 10.05YY104 pKa = 10.45FGKK107 pKa = 10.34FDD109 pKa = 4.32LARR112 pKa = 11.84KK113 pKa = 9.56SSGSRR118 pKa = 11.84KK119 pKa = 9.43EE120 pKa = 3.81DD121 pKa = 3.12GRR123 pKa = 11.84DD124 pKa = 3.33YY125 pKa = 11.04RR126 pKa = 11.84QGARR130 pKa = 11.84SSS132 pKa = 3.29
MM1 pKa = 6.98GCARR5 pKa = 11.84VKK7 pKa = 10.44GAQQSLSARR16 pKa = 11.84LQRR19 pKa = 11.84EE20 pKa = 3.81CRR22 pKa = 11.84AIARR26 pKa = 11.84FLVGANEE33 pKa = 4.16MADD36 pKa = 3.21IFPPHH41 pKa = 6.58LSGVNEE47 pKa = 4.01MKK49 pKa = 10.78LGGGFAFRR57 pKa = 11.84PHH59 pKa = 6.97KK60 pKa = 10.5PPIRR64 pKa = 11.84YY65 pKa = 8.75ILCLIFQFSFQQLTSSLLFNRR86 pKa = 11.84ALVLVQLAKK95 pKa = 10.24EE96 pKa = 4.1LPSFVRR102 pKa = 11.84KK103 pKa = 10.05YY104 pKa = 10.45FGKK107 pKa = 10.34FDD109 pKa = 4.32LARR112 pKa = 11.84KK113 pKa = 9.56SSGSRR118 pKa = 11.84KK119 pKa = 9.43EE120 pKa = 3.81DD121 pKa = 3.12GRR123 pKa = 11.84DD124 pKa = 3.33YY125 pKa = 11.04RR126 pKa = 11.84QGARR130 pKa = 11.84SSS132 pKa = 3.29
Molecular weight: 14.86 kDa
Isoelectric point according different methods:
Peptides (in silico digests for buttom-up proteomics)
Below you can find in silico digests of the whole proteome with Trypsin, Chymotrypsin, Trypsin+LysC, LysN, ArgC proteases suitable for different mass spec machines.| Try ESI |
 |
|---|
| ChTry ESI |
 |
|---|
| ArgC ESI |
 |
|---|
| LysN ESI |
 |
|---|
| TryLysC ESI |
 |
|---|
| Try MALDI |
 |
|---|
| ChTry MALDI |
 |
|---|
| ArgC MALDI |
 |
|---|
| LysN MALDI |
 |
|---|
| TryLysC MALDI |
 |
|---|
| Try LTQ |
 |
|---|
| ChTry LTQ |
 |
|---|
| ArgC LTQ |
 |
|---|
| LysN LTQ |
 |
|---|
| TryLysC LTQ |
 |
|---|
| Try MSlow |
 |
|---|
| ChTry MSlow |
 |
|---|
| ArgC MSlow |
 |
|---|
| LysN MSlow |
 |
|---|
| TryLysC MSlow |
 |
|---|
| Try MShigh |
 |
|---|
| ChTry MShigh |
 |
|---|
| ArgC MShigh |
 |
|---|
| LysN MShigh |
 |
|---|
| TryLysC MShigh |
 |
|---|
General Statistics
Number of major isoforms |
Number of additional isoforms |
Number of all proteins |
Number of amino acids |
Min. Seq. Length |
Max. Seq. Length |
Avg. Seq. Length |
Avg. Mol. Weight |
|---|---|---|---|---|---|---|---|
0 |
145563 |
52 |
1198 |
216.9 |
24.57 |
Amino acid frequency
Ala |
Cys |
Asp |
Glu |
Phe |
Gly |
His |
Ile |
Lys |
Leu |
|---|---|---|---|---|---|---|---|---|---|
5.681 ± 0.092 | 0.973 ± 0.037 |
5.697 ± 0.098 | 10.531 ± 0.162 |
4.14 ± 0.095 | 7.228 ± 0.104 |
1.622 ± 0.04 | 7.146 ± 0.088 |
7.768 ± 0.11 | 9.395 ± 0.126 |
Met |
Asn |
Gln |
Pro |
Arg |
Ser |
Thr |
Val |
Trp |
Tyr |
|---|---|---|---|---|---|---|---|---|---|
2.23 ± 0.045 | 3.721 ± 0.073 |
3.849 ± 0.058 | 2.282 ± 0.042 |
5.879 ± 0.089 | 6.275 ± 0.072 |
4.692 ± 0.069 | 6.799 ± 0.089 |
1.079 ± 0.046 | 3.01 ± 0.061 |
Most of the basic statistics you can see at this page can be downloaded from this CSV file
Proteome-pI is available under Creative Commons Attribution-NoDerivs license, for more details see here
| Reference: Kozlowski LP. Proteome-pI 2.0: Proteome Isoelectric Point Database Update. Nucleic Acids Res. 2021, doi: 10.1093/nar/gkab944 | Contact: Lukasz P. Kozlowski |
