Microcaecilia unicolor
Taxonomy: cellular organisms; Eukaryota; Opisthokonta; Metazoa; Eumetazoa; Bilateria; Deuterostomia; Chordata; Craniata; Vertebrata; Gnathostomata; Teleostomi; Euteleostomi; Sarcopterygii; Dipnotetrapodomorpha; Tetrapoda; Amphibia; Gymnophiona; Siphonopidae; Microcaecilia
Average proteome isoelectric point is 6.62
Get precalculated fractions of proteins
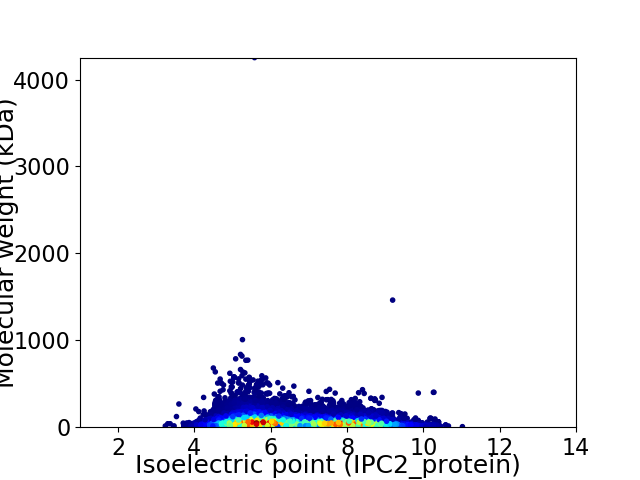
Virtual 2D-PAGE plot for 30305 proteins (isoelectric point calculated using IPC2_protein)
Get csv file with sequences according to given criteria:
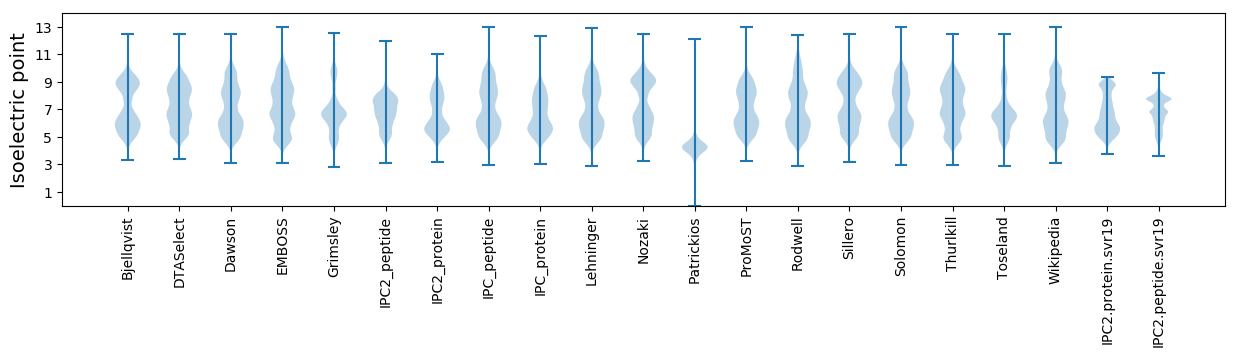
* You can choose from 21 different methods for calculating isoelectric point
Summary statistics related to proteome-wise predictions
Protein with the lowest isoelectric point:
>tr|A0A6P7X3Q8|A0A6P7X3Q8_9AMPH E3 ubiquitin-protein ligase TRIM39-like OS=Microcaecilia unicolor OX=1415580 GN=LOC115459515 PE=4 SV=1
LL1 pKa = 7.54RR2 pKa = 11.84KK3 pKa = 8.26TSKK6 pKa = 11.0GDD8 pKa = 4.19DD9 pKa = 3.26ILEE12 pKa = 4.44QGDD15 pKa = 3.51VWQSAEE21 pKa = 4.19KK22 pKa = 9.58WCSQLFCAGVPMMEE36 pKa = 4.37EE37 pKa = 3.95NEE39 pKa = 4.28EE40 pKa = 4.05EE41 pKa = 5.16DD42 pKa = 4.38RR43 pKa = 11.84MQLFDD48 pKa = 5.32LDD50 pKa = 4.8CFLSDD55 pKa = 4.37ISDD58 pKa = 3.82TLFTMTQGMCAPPTVSDD75 pKa = 3.99CDD77 pKa = 3.75YY78 pKa = 11.32AGNADD83 pKa = 4.71MIQPDD88 pKa = 4.43LTQLQPNLDD97 pKa = 4.18DD98 pKa = 5.87FMDD101 pKa = 3.97IPEE104 pKa = 4.62LSLTKK109 pKa = 10.27HH110 pKa = 6.17CLWSDD115 pKa = 3.22QQNYY119 pKa = 9.82SKK121 pKa = 10.97VIRR124 pKa = 11.84FLLDD128 pKa = 2.89ILIIQILNIGVGFSSLLQSYY148 pKa = 9.92
LL1 pKa = 7.54RR2 pKa = 11.84KK3 pKa = 8.26TSKK6 pKa = 11.0GDD8 pKa = 4.19DD9 pKa = 3.26ILEE12 pKa = 4.44QGDD15 pKa = 3.51VWQSAEE21 pKa = 4.19KK22 pKa = 9.58WCSQLFCAGVPMMEE36 pKa = 4.37EE37 pKa = 3.95NEE39 pKa = 4.28EE40 pKa = 4.05EE41 pKa = 5.16DD42 pKa = 4.38RR43 pKa = 11.84MQLFDD48 pKa = 5.32LDD50 pKa = 4.8CFLSDD55 pKa = 4.37ISDD58 pKa = 3.82TLFTMTQGMCAPPTVSDD75 pKa = 3.99CDD77 pKa = 3.75YY78 pKa = 11.32AGNADD83 pKa = 4.71MIQPDD88 pKa = 4.43LTQLQPNLDD97 pKa = 4.18DD98 pKa = 5.87FMDD101 pKa = 3.97IPEE104 pKa = 4.62LSLTKK109 pKa = 10.27HH110 pKa = 6.17CLWSDD115 pKa = 3.22QQNYY119 pKa = 9.82SKK121 pKa = 10.97VIRR124 pKa = 11.84FLLDD128 pKa = 2.89ILIIQILNIGVGFSSLLQSYY148 pKa = 9.92
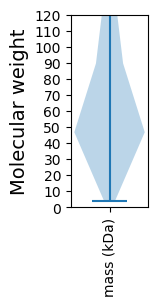
Molecular weight: 16.85 kDa
Isoelectric point according different methods:
Protein with the highest isoelectric point:
>tr|A0A6P7YPY7|A0A6P7YPY7_9AMPH Histone acetyltransferase OS=Microcaecilia unicolor OX=1415580 GN=KAT8 PE=3 SV=1
MM1 pKa = 7.57SSHH4 pKa = 6.01KK5 pKa = 9.07TFKK8 pKa = 10.28IKK10 pKa = 10.6RR11 pKa = 11.84FLAKK15 pKa = 9.68KK16 pKa = 9.58QKK18 pKa = 8.69QNRR21 pKa = 11.84PIPQWIRR28 pKa = 11.84MKK30 pKa = 9.89TGNKK34 pKa = 8.61IRR36 pKa = 11.84YY37 pKa = 7.09NSKK40 pKa = 8.3RR41 pKa = 11.84RR42 pKa = 11.84HH43 pKa = 3.95WRR45 pKa = 11.84RR46 pKa = 11.84TKK48 pKa = 10.83LGLL51 pKa = 3.67
MM1 pKa = 7.57SSHH4 pKa = 6.01KK5 pKa = 9.07TFKK8 pKa = 10.28IKK10 pKa = 10.6RR11 pKa = 11.84FLAKK15 pKa = 9.68KK16 pKa = 9.58QKK18 pKa = 8.69QNRR21 pKa = 11.84PIPQWIRR28 pKa = 11.84MKK30 pKa = 9.89TGNKK34 pKa = 8.61IRR36 pKa = 11.84YY37 pKa = 7.09NSKK40 pKa = 8.3RR41 pKa = 11.84RR42 pKa = 11.84HH43 pKa = 3.95WRR45 pKa = 11.84RR46 pKa = 11.84TKK48 pKa = 10.83LGLL51 pKa = 3.67
Molecular weight: 6.38 kDa
Isoelectric point according different methods:
Peptides (in silico digests for buttom-up proteomics)
Below you can find in silico digests of the whole proteome with Trypsin, Chymotrypsin, Trypsin+LysC, LysN, ArgC proteases suitable for different mass spec machines.| Try ESI |
 |
|---|
| ChTry ESI |
|
|---|
| ArgC ESI |
|
|---|
| LysN ESI |
|
|---|
| TryLysC ESI |
|
|---|
| Try MALDI |
|
|---|
| ChTry MALDI |
|
|---|
| ArgC MALDI |
|
|---|
| LysN MALDI |
|
|---|
| TryLysC MALDI |
|
|---|
| Try LTQ |
|
|---|
| ChTry LTQ |
|
|---|
| ArgC LTQ |
|
|---|
| LysN LTQ |
|
|---|
| TryLysC LTQ |
|
|---|
| Try MSlow |
|
|---|
| ChTry MSlow |
|
|---|
| ArgC MSlow |
|
|---|
| LysN MSlow |
|
|---|
| TryLysC MSlow |
|
|---|
| Try MShigh |
|
|---|
| ChTry MShigh |
|
|---|
| ArgC MShigh |
|
|---|
| LysN MShigh |
|
|---|
| TryLysC MShigh |
|
|---|
General Statistics
Number of major isoforms |
Number of additional isoforms |
Number of all proteins |
Number of amino acids |
Min. Seq. Length |
Max. Seq. Length |
Avg. Seq. Length |
Avg. Mol. Weight |
|---|---|---|---|---|---|---|---|
18831892 |
31 |
38163 |
621.4 |
69.78 |
Amino acid frequency
Ala |
Cys |
Asp |
Glu |
Phe |
Gly |
His |
Ile |
Lys |
Leu |
|---|---|---|---|---|---|---|---|---|---|
5.998 ± 0.015 | 2.277 ± 0.013 |
4.947 ± 0.01 | 7.273 ± 0.02 |
3.758 ± 0.011 | 5.787 ± 0.019 |
2.622 ± 0.008 | 5.004 ± 0.011 |
6.455 ± 0.016 | 9.457 ± 0.022 |
Met |
Asn |
Gln |
Pro |
Arg |
Ser |
Thr |
Val |
Trp |
Tyr |
|---|---|---|---|---|---|---|---|---|---|
2.346 ± 0.006 | 4.164 ± 0.01 |
5.387 ± 0.016 | 4.966 ± 0.021 |
5.197 ± 0.013 | 8.743 ± 0.019 |
5.737 ± 0.03 | 5.953 ± 0.012 |
1.116 ± 0.004 | 2.8 ± 0.008 |
Most of the basic statistics you can see at this page can be downloaded from this CSV file
See this proteome in:

Proteome-pI is available under Creative Commons Attribution-NoDerivs license, for more details see here
| Reference: Kozlowski LP. Proteome-pI 2.0: Proteome Isoelectric Point Database Update. Nucleic Acids Res. 2021, doi: 10.1093/nar/gkab944 | Contact: Lukasz P. Kozlowski |