Bondarzewia mesenterica
Taxonomy: cellular organisms; Eukaryota; Opisthokonta; Fungi; Dikarya; Basidiomycota; Agaricomycotina; Agaricomycetes; Agaricomycetes incertae sedis; Russulales; Bondarzewiaceae; Bondarzewia
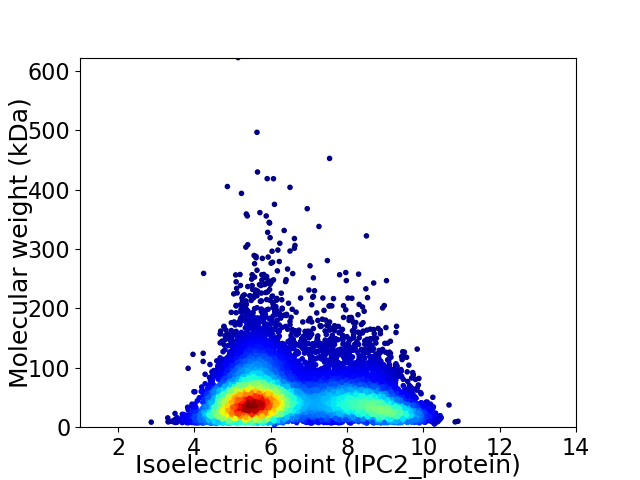
Average proteome isoelectric point is 6.55
Get precalculated fractions of proteins

Virtual 2D-PAGE plot for 10514 proteins (isoelectric point calculated using IPC2_protein)
Get csv file with sequences according to given criteria:
* You can choose from 21 different methods for calculating isoelectric point
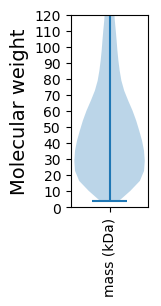
Summary statistics related to proteome-wise predictions


Protein with the lowest isoelectric point:
>tr|A0A4S4LSZ6|A0A4S4LSZ6_9AGAM Uncharacterized protein OS=Bondarzewia mesenterica OX=1095465 GN=EW146_g6886 PE=4 SV=1
MM1 pKa = 7.63SSEE4 pKa = 4.22PPSLVSYY11 pKa = 10.61ARR13 pKa = 11.84SKK15 pKa = 10.86LHH17 pKa = 6.3LAVGSGSKK25 pKa = 10.27DD26 pKa = 2.91KK27 pKa = 11.11CSLHH31 pKa = 6.45RR32 pKa = 11.84WVLLKK37 pKa = 11.06NSITRR42 pKa = 11.84SQPSIVPSCNSNSMADD58 pKa = 3.44VNLVYY63 pKa = 10.07NTDD66 pKa = 3.24VGEE69 pKa = 4.36VEE71 pKa = 5.08VEE73 pKa = 4.18DD74 pKa = 4.56EE75 pKa = 4.45DD76 pKa = 4.12VCSEE80 pKa = 4.2EE81 pKa = 4.14EE82 pKa = 3.87HH83 pKa = 7.16DD84 pKa = 5.33SFMFPDD90 pKa = 4.18AGRR93 pKa = 11.84LVHH96 pKa = 6.61QSRR99 pKa = 11.84SSDD102 pKa = 3.18ADD104 pKa = 3.23GSEE107 pKa = 4.17SQWLDD112 pKa = 3.27SLLEE116 pKa = 4.05TLGEE120 pKa = 4.07EE121 pKa = 5.67DD122 pKa = 3.6EE123 pKa = 5.52DD124 pKa = 4.82EE125 pKa = 4.64YY126 pKa = 11.76DD127 pKa = 4.09SDD129 pKa = 3.99VHH131 pKa = 6.27PSLMHH136 pKa = 7.15GDD138 pKa = 4.82DD139 pKa = 3.64EE140 pKa = 5.3DD141 pKa = 4.27EE142 pKa = 4.77PPFTPSTSPMSSSDD156 pKa = 3.95DD157 pKa = 3.71LTIHH161 pKa = 6.65PVYY164 pKa = 10.18FDD166 pKa = 4.42PPISMPYY173 pKa = 9.13PIVYY177 pKa = 9.33PPYY180 pKa = 9.09HH181 pKa = 6.25SQFIPALEE189 pKa = 4.13FGPLNSPLDD198 pKa = 3.66SSYY201 pKa = 11.38PPLNVALPYY210 pKa = 10.65YY211 pKa = 10.63DD212 pKa = 5.46ADD214 pKa = 4.55DD215 pKa = 4.62VDD217 pKa = 5.21DD218 pKa = 5.82LPVPDD223 pKa = 5.7AIEE226 pKa = 4.97DD227 pKa = 3.87EE228 pKa = 4.73SDD230 pKa = 3.89DD231 pKa = 4.23EE232 pKa = 5.55SDD234 pKa = 4.57ALSTPSNSRR243 pKa = 11.84SISSFVEE250 pKa = 3.81PSTPQSRR257 pKa = 11.84QRR259 pKa = 11.84PLPQVYY265 pKa = 9.86VDD267 pKa = 4.26SDD269 pKa = 3.46DD270 pKa = 4.44SYY272 pKa = 11.75FYY274 pKa = 10.55PFEE277 pKa = 5.38LDD279 pKa = 3.73PLPFPDD285 pKa = 4.66DD286 pKa = 3.69HH287 pKa = 6.24RR288 pKa = 11.84TSPLVFNNAYY298 pKa = 9.83HH299 pKa = 5.4QEE301 pKa = 4.23CC302 pKa = 4.16
MM1 pKa = 7.63SSEE4 pKa = 4.22PPSLVSYY11 pKa = 10.61ARR13 pKa = 11.84SKK15 pKa = 10.86LHH17 pKa = 6.3LAVGSGSKK25 pKa = 10.27DD26 pKa = 2.91KK27 pKa = 11.11CSLHH31 pKa = 6.45RR32 pKa = 11.84WVLLKK37 pKa = 11.06NSITRR42 pKa = 11.84SQPSIVPSCNSNSMADD58 pKa = 3.44VNLVYY63 pKa = 10.07NTDD66 pKa = 3.24VGEE69 pKa = 4.36VEE71 pKa = 5.08VEE73 pKa = 4.18DD74 pKa = 4.56EE75 pKa = 4.45DD76 pKa = 4.12VCSEE80 pKa = 4.2EE81 pKa = 4.14EE82 pKa = 3.87HH83 pKa = 7.16DD84 pKa = 5.33SFMFPDD90 pKa = 4.18AGRR93 pKa = 11.84LVHH96 pKa = 6.61QSRR99 pKa = 11.84SSDD102 pKa = 3.18ADD104 pKa = 3.23GSEE107 pKa = 4.17SQWLDD112 pKa = 3.27SLLEE116 pKa = 4.05TLGEE120 pKa = 4.07EE121 pKa = 5.67DD122 pKa = 3.6EE123 pKa = 5.52DD124 pKa = 4.82EE125 pKa = 4.64YY126 pKa = 11.76DD127 pKa = 4.09SDD129 pKa = 3.99VHH131 pKa = 6.27PSLMHH136 pKa = 7.15GDD138 pKa = 4.82DD139 pKa = 3.64EE140 pKa = 5.3DD141 pKa = 4.27EE142 pKa = 4.77PPFTPSTSPMSSSDD156 pKa = 3.95DD157 pKa = 3.71LTIHH161 pKa = 6.65PVYY164 pKa = 10.18FDD166 pKa = 4.42PPISMPYY173 pKa = 9.13PIVYY177 pKa = 9.33PPYY180 pKa = 9.09HH181 pKa = 6.25SQFIPALEE189 pKa = 4.13FGPLNSPLDD198 pKa = 3.66SSYY201 pKa = 11.38PPLNVALPYY210 pKa = 10.65YY211 pKa = 10.63DD212 pKa = 5.46ADD214 pKa = 4.55DD215 pKa = 4.62VDD217 pKa = 5.21DD218 pKa = 5.82LPVPDD223 pKa = 5.7AIEE226 pKa = 4.97DD227 pKa = 3.87EE228 pKa = 4.73SDD230 pKa = 3.89DD231 pKa = 4.23EE232 pKa = 5.55SDD234 pKa = 4.57ALSTPSNSRR243 pKa = 11.84SISSFVEE250 pKa = 3.81PSTPQSRR257 pKa = 11.84QRR259 pKa = 11.84PLPQVYY265 pKa = 9.86VDD267 pKa = 4.26SDD269 pKa = 3.46DD270 pKa = 4.44SYY272 pKa = 11.75FYY274 pKa = 10.55PFEE277 pKa = 5.38LDD279 pKa = 3.73PLPFPDD285 pKa = 4.66DD286 pKa = 3.69HH287 pKa = 6.24RR288 pKa = 11.84TSPLVFNNAYY298 pKa = 9.83HH299 pKa = 5.4QEE301 pKa = 4.23CC302 pKa = 4.16
Molecular weight: 33.63 kDa
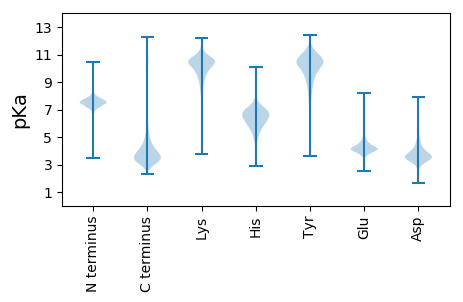
Isoelectric point according different methods:
Protein with the highest isoelectric point:
>tr|A0A4S4LU38|A0A4S4LU38_9AGAM Serine/threonine-protein kinase Tel1 OS=Bondarzewia mesenterica OX=1095465 GN=EW146_g5182 PE=3 SV=1
MM1 pKa = 7.04TGARR5 pKa = 11.84RR6 pKa = 11.84TGRR9 pKa = 11.84VVSRR13 pKa = 11.84VHH15 pKa = 6.17EE16 pKa = 4.27LGGNGNGNGSAQRR29 pKa = 11.84IFLFTSRR36 pKa = 11.84PAAPPQLHH44 pKa = 6.61PRR46 pKa = 11.84LRR48 pKa = 11.84PPSHH52 pKa = 6.81NKK54 pKa = 9.28PPPPPPHH61 pKa = 5.93TTTPAAPAAVANPRR75 pKa = 11.84PPARR79 pKa = 11.84TPHH82 pKa = 5.7TPAA85 pKa = 5.36
MM1 pKa = 7.04TGARR5 pKa = 11.84RR6 pKa = 11.84TGRR9 pKa = 11.84VVSRR13 pKa = 11.84VHH15 pKa = 6.17EE16 pKa = 4.27LGGNGNGNGSAQRR29 pKa = 11.84IFLFTSRR36 pKa = 11.84PAAPPQLHH44 pKa = 6.61PRR46 pKa = 11.84LRR48 pKa = 11.84PPSHH52 pKa = 6.81NKK54 pKa = 9.28PPPPPPHH61 pKa = 5.93TTTPAAPAAVANPRR75 pKa = 11.84PPARR79 pKa = 11.84TPHH82 pKa = 5.7TPAA85 pKa = 5.36
Molecular weight: 8.92 kDa
Isoelectric point according different methods:
Peptides (in silico digests for buttom-up proteomics)
Below you can find in silico digests of the whole proteome with Trypsin, Chymotrypsin, Trypsin+LysC, LysN, ArgC proteases suitable for different mass spec machines.| Try ESI |
 |
|---|
| ChTry ESI |
 |
|---|
| ArgC ESI |
 |
|---|
| LysN ESI |
 |
|---|
| TryLysC ESI |
 |
|---|
| Try MALDI |
 |
|---|
| ChTry MALDI |
 |
|---|
| ArgC MALDI |
 |
|---|
| LysN MALDI |
 |
|---|
| TryLysC MALDI |
 |
|---|
| Try LTQ |
 |
|---|
| ChTry LTQ |
 |
|---|
| ArgC LTQ |
 |
|---|
| LysN LTQ |
 |
|---|
| TryLysC LTQ |
 |
|---|
| Try MSlow |
 |
|---|
| ChTry MSlow |
 |
|---|
| ArgC MSlow |
 |
|---|
| LysN MSlow |
 |
|---|
| TryLysC MSlow |
 |
|---|
| Try MShigh |
 |
|---|
| ChTry MShigh |
 |
|---|
| ArgC MShigh |
 |
|---|
| LysN MShigh |
 |
|---|
| TryLysC MShigh |
 |
|---|
General Statistics
Number of major isoforms |
Number of additional isoforms |
Number of all proteins |
Number of amino acids |
Min. Seq. Length |
Max. Seq. Length |
Avg. Seq. Length |
Avg. Mol. Weight |
|---|---|---|---|---|---|---|---|
0 |
5388005 |
35 |
5577 |
512.5 |
56.41 |
Amino acid frequency
Ala |
Cys |
Asp |
Glu |
Phe |
Gly |
His |
Ile |
Lys |
Leu |
|---|---|---|---|---|---|---|---|---|---|
8.622 ± 0.018 | 1.209 ± 0.008 |
5.636 ± 0.014 | 5.86 ± 0.022 |
3.728 ± 0.015 | 6.284 ± 0.017 |
2.68 ± 0.012 | 4.835 ± 0.014 |
4.35 ± 0.019 | 9.222 ± 0.023 |
Met |
Asn |
Gln |
Pro |
Arg |
Ser |
Thr |
Val |
Trp |
Tyr |
|---|---|---|---|---|---|---|---|---|---|
2.106 ± 0.008 | 3.259 ± 0.011 |
6.617 ± 0.026 | 3.634 ± 0.013 |
6.358 ± 0.018 | 9.038 ± 0.029 |
5.921 ± 0.014 | 6.347 ± 0.015 |
1.387 ± 0.007 | 2.543 ± 0.01 |
Most of the basic statistics you can see at this page can be downloaded from this CSV file
Proteome-pI is available under Creative Commons Attribution-NoDerivs license, for more details see here
| Reference: Kozlowski LP. Proteome-pI 2.0: Proteome Isoelectric Point Database Update. Nucleic Acids Res. 2021, doi: 10.1093/nar/gkab944 | Contact: Lukasz P. Kozlowski |
