Sphingorhabdus contaminans
Taxonomy: cellular organisms; Bacteria; Proteobacteria; Alphaproteobacteria; Sphingomonadales; Sphingomonadaceae; Sphingorhabdus
Average proteome isoelectric point is 6.35
Get precalculated fractions of proteins

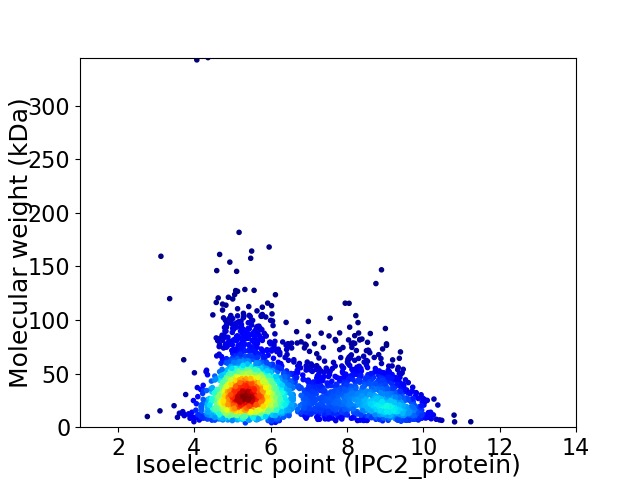
Virtual 2D-PAGE plot for 3099 proteins (isoelectric point calculated using IPC2_protein)
Get csv file with sequences according to given criteria:
* You can choose from 21 different methods for calculating isoelectric point
Summary statistics related to proteome-wise predictions


Protein with the lowest isoelectric point:
>tr|A0A553WL52|A0A553WL52_9SPHN WalW protein OS=Sphingorhabdus contaminans OX=1343899 GN=FOM92_04810 PE=4 SV=1
MM1 pKa = 7.57LSCGLPASAFAQTVNQYY18 pKa = 9.68TNSTTGNIVDD28 pKa = 4.16STTCATTVTRR38 pKa = 11.84TFTVGTNFTVADD50 pKa = 3.83VNLGVLLSHH59 pKa = 7.12TYY61 pKa = 10.55RR62 pKa = 11.84SDD64 pKa = 3.25LRR66 pKa = 11.84ITLTSPLGTSVQIMTNVGGAADD88 pKa = 3.93NLNVLFDD95 pKa = 4.77DD96 pKa = 4.54EE97 pKa = 4.14AAAAISSHH105 pKa = 5.25STNDD109 pKa = 3.05TTGAVPPYY117 pKa = 10.3LRR119 pKa = 11.84TFRR122 pKa = 11.84PTAALTAFDD131 pKa = 4.48GQSSLGTWTMVICDD145 pKa = 4.06SVLADD150 pKa = 3.11VGTFTRR156 pKa = 11.84ADD158 pKa = 3.89LYY160 pKa = 10.32LTSAPASYY168 pKa = 11.52ADD170 pKa = 4.0LSLTKK175 pKa = 9.73TVSNANPASGGAISYY190 pKa = 7.59TLSVTNSASSPTAASGVTVLDD211 pKa = 3.53ILPAGVSFVSASGFGSYY228 pKa = 10.95DD229 pKa = 3.08SATGVWTVGSIPAGTTRR246 pKa = 11.84TLTINVTVTAGLGTTIQNDD265 pKa = 4.09TEE267 pKa = 4.24ISASSVADD275 pKa = 4.08LDD277 pKa = 3.97STPNNASINEE287 pKa = 4.18DD288 pKa = 3.11DD289 pKa = 4.4DD290 pKa = 4.62AAVSFTTTGTRR301 pKa = 11.84TAGTPPTLVCPNGTTLLDD319 pKa = 3.43WNAQSWTSGSSTGTATVANIGAIGFNVTTQGTFTIPLQLNATITGGTTGQNSLYY373 pKa = 10.79QNVEE377 pKa = 3.86YY378 pKa = 7.71TTRR381 pKa = 11.84TQTTTTVVTLPTAVPGAQFTIFDD404 pKa = 3.52VDD406 pKa = 3.55YY407 pKa = 10.86APNDD411 pKa = 3.63FADD414 pKa = 3.7KK415 pKa = 8.63MTITGTYY422 pKa = 9.07NGASVTPTLTNGVTNYY438 pKa = 9.87VFGNVAIGDD447 pKa = 3.86VTASDD452 pKa = 3.67TTNQGTVVATFSSPVDD468 pKa = 3.71TITIVYY474 pKa = 9.38GNHH477 pKa = 4.23TTAPADD483 pKa = 3.71PDD485 pKa = 3.71GQAIAINDD493 pKa = 3.6FTFCNPQTTLSVTKK507 pKa = 10.47LSNVVSDD514 pKa = 4.59GVSGSNPKK522 pKa = 9.86SVPGAVVRR530 pKa = 11.84YY531 pKa = 8.7CVLVSNSGSATSSNVVATDD550 pKa = 4.21SIPANLTFVPGSMLSGTSCAAATTAEE576 pKa = 4.65DD577 pKa = 4.49DD578 pKa = 4.06NNSGGDD584 pKa = 3.39EE585 pKa = 4.1SDD587 pKa = 3.51PFGMDD592 pKa = 3.43FAGNVVTGRR601 pKa = 11.84AASLGPAASFAMVFNTTVNN620 pKa = 3.29
MM1 pKa = 7.57LSCGLPASAFAQTVNQYY18 pKa = 9.68TNSTTGNIVDD28 pKa = 4.16STTCATTVTRR38 pKa = 11.84TFTVGTNFTVADD50 pKa = 3.83VNLGVLLSHH59 pKa = 7.12TYY61 pKa = 10.55RR62 pKa = 11.84SDD64 pKa = 3.25LRR66 pKa = 11.84ITLTSPLGTSVQIMTNVGGAADD88 pKa = 3.93NLNVLFDD95 pKa = 4.77DD96 pKa = 4.54EE97 pKa = 4.14AAAAISSHH105 pKa = 5.25STNDD109 pKa = 3.05TTGAVPPYY117 pKa = 10.3LRR119 pKa = 11.84TFRR122 pKa = 11.84PTAALTAFDD131 pKa = 4.48GQSSLGTWTMVICDD145 pKa = 4.06SVLADD150 pKa = 3.11VGTFTRR156 pKa = 11.84ADD158 pKa = 3.89LYY160 pKa = 10.32LTSAPASYY168 pKa = 11.52ADD170 pKa = 4.0LSLTKK175 pKa = 9.73TVSNANPASGGAISYY190 pKa = 7.59TLSVTNSASSPTAASGVTVLDD211 pKa = 3.53ILPAGVSFVSASGFGSYY228 pKa = 10.95DD229 pKa = 3.08SATGVWTVGSIPAGTTRR246 pKa = 11.84TLTINVTVTAGLGTTIQNDD265 pKa = 4.09TEE267 pKa = 4.24ISASSVADD275 pKa = 4.08LDD277 pKa = 3.97STPNNASINEE287 pKa = 4.18DD288 pKa = 3.11DD289 pKa = 4.4DD290 pKa = 4.62AAVSFTTTGTRR301 pKa = 11.84TAGTPPTLVCPNGTTLLDD319 pKa = 3.43WNAQSWTSGSSTGTATVANIGAIGFNVTTQGTFTIPLQLNATITGGTTGQNSLYY373 pKa = 10.79QNVEE377 pKa = 3.86YY378 pKa = 7.71TTRR381 pKa = 11.84TQTTTTVVTLPTAVPGAQFTIFDD404 pKa = 3.52VDD406 pKa = 3.55YY407 pKa = 10.86APNDD411 pKa = 3.63FADD414 pKa = 3.7KK415 pKa = 8.63MTITGTYY422 pKa = 9.07NGASVTPTLTNGVTNYY438 pKa = 9.87VFGNVAIGDD447 pKa = 3.86VTASDD452 pKa = 3.67TTNQGTVVATFSSPVDD468 pKa = 3.71TITIVYY474 pKa = 9.38GNHH477 pKa = 4.23TTAPADD483 pKa = 3.71PDD485 pKa = 3.71GQAIAINDD493 pKa = 3.6FTFCNPQTTLSVTKK507 pKa = 10.47LSNVVSDD514 pKa = 4.59GVSGSNPKK522 pKa = 9.86SVPGAVVRR530 pKa = 11.84YY531 pKa = 8.7CVLVSNSGSATSSNVVATDD550 pKa = 4.21SIPANLTFVPGSMLSGTSCAAATTAEE576 pKa = 4.65DD577 pKa = 4.49DD578 pKa = 4.06NNSGGDD584 pKa = 3.39EE585 pKa = 4.1SDD587 pKa = 3.51PFGMDD592 pKa = 3.43FAGNVVTGRR601 pKa = 11.84AASLGPAASFAMVFNTTVNN620 pKa = 3.29
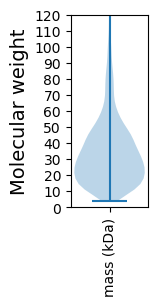
Molecular weight: 62.91 kDa
Isoelectric point according different methods:
Protein with the highest isoelectric point:
>tr|A0A553WKC7|A0A553WKC7_9SPHN Sodium/solute symporter OS=Sphingorhabdus contaminans OX=1343899 GN=FOM92_07315 PE=3 SV=1
MM1 pKa = 7.45KK2 pKa = 9.61RR3 pKa = 11.84TFQPSNLVRR12 pKa = 11.84ARR14 pKa = 11.84RR15 pKa = 11.84HH16 pKa = 4.37GFRR19 pKa = 11.84LRR21 pKa = 11.84MSTASGRR28 pKa = 11.84AILNARR34 pKa = 11.84RR35 pKa = 11.84ARR37 pKa = 11.84GRR39 pKa = 11.84KK40 pKa = 9.02KK41 pKa = 10.61LSAA44 pKa = 4.03
MM1 pKa = 7.45KK2 pKa = 9.61RR3 pKa = 11.84TFQPSNLVRR12 pKa = 11.84ARR14 pKa = 11.84RR15 pKa = 11.84HH16 pKa = 4.37GFRR19 pKa = 11.84LRR21 pKa = 11.84MSTASGRR28 pKa = 11.84AILNARR34 pKa = 11.84RR35 pKa = 11.84ARR37 pKa = 11.84GRR39 pKa = 11.84KK40 pKa = 9.02KK41 pKa = 10.61LSAA44 pKa = 4.03
Molecular weight: 5.08 kDa
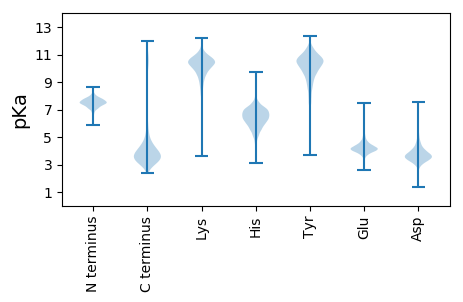
Isoelectric point according different methods:
Peptides (in silico digests for buttom-up proteomics)
Below you can find in silico digests of the whole proteome with Trypsin, Chymotrypsin, Trypsin+LysC, LysN, ArgC proteases suitable for different mass spec machines.| Try ESI |
 |
|---|
| ChTry ESI |
 |
|---|
| ArgC ESI |
 |
|---|
| LysN ESI |
 |
|---|
| TryLysC ESI |
 |
|---|
| Try MALDI |
 |
|---|
| ChTry MALDI |
 |
|---|
| ArgC MALDI |
 |
|---|
| LysN MALDI |
 |
|---|
| TryLysC MALDI |
 |
|---|
| Try LTQ |
 |
|---|
| ChTry LTQ |
 |
|---|
| ArgC LTQ |
 |
|---|
| LysN LTQ |
 |
|---|
| TryLysC LTQ |
 |
|---|
| Try MSlow |
 |
|---|
| ChTry MSlow |
 |
|---|
| ArgC MSlow |
 |
|---|
| LysN MSlow |
 |
|---|
| TryLysC MSlow |
 |
|---|
| Try MShigh |
 |
|---|
| ChTry MShigh |
 |
|---|
| ArgC MShigh |
 |
|---|
| LysN MShigh |
 |
|---|
| TryLysC MShigh |
 |
|---|
General Statistics
Number of major isoforms |
Number of additional isoforms |
Number of all proteins |
Number of amino acids |
Min. Seq. Length |
Max. Seq. Length |
Avg. Seq. Length |
Avg. Mol. Weight |
|---|---|---|---|---|---|---|---|
0 |
1006683 |
40 |
3552 |
324.8 |
35.27 |
Amino acid frequency
Ala |
Cys |
Asp |
Glu |
Phe |
Gly |
His |
Ile |
Lys |
Leu |
|---|---|---|---|---|---|---|---|---|---|
12.058 ± 0.066 | 0.842 ± 0.016 |
5.928 ± 0.035 | 5.531 ± 0.047 |
3.827 ± 0.03 | 8.646 ± 0.068 |
1.975 ± 0.025 | 5.647 ± 0.029 |
3.905 ± 0.036 | 9.506 ± 0.056 |
Met |
Asn |
Gln |
Pro |
Arg |
Ser |
Thr |
Val |
Trp |
Tyr |
|---|---|---|---|---|---|---|---|---|---|
2.582 ± 0.026 | 3.204 ± 0.045 |
4.959 ± 0.038 | 3.24 ± 0.023 |
6.293 ± 0.048 | 5.773 ± 0.035 |
5.327 ± 0.045 | 6.937 ± 0.033 |
1.425 ± 0.019 | 2.396 ± 0.024 |
Most of the basic statistics you can see at this page can be downloaded from this CSV file
Proteome-pI is available under Creative Commons Attribution-NoDerivs license, for more details see here
| Reference: Kozlowski LP. Proteome-pI 2.0: Proteome Isoelectric Point Database Update. Nucleic Acids Res. 2021, doi: 10.1093/nar/gkab944 | Contact: Lukasz P. Kozlowski |
