Roseobacter virus SIO1
Taxonomy: Viruses; Duplodnaviria; Heunggongvirae; Uroviricota; Caudoviricetes; Caudovirales; Zobellviridae; Cobavirinae; Siovirus
Average proteome isoelectric point is 6.08
Get precalculated fractions of proteins

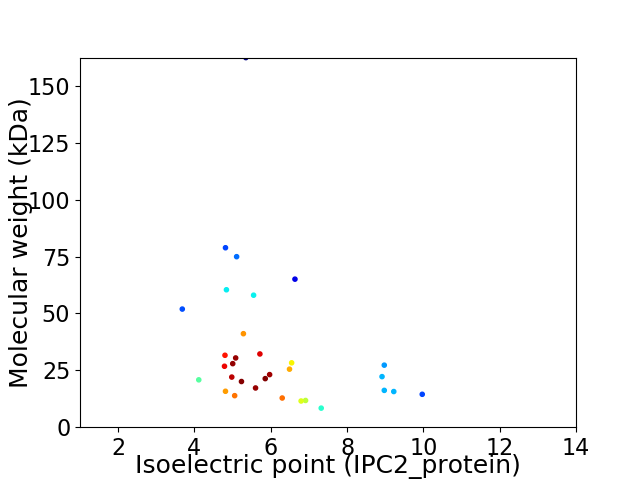
Virtual 2D-PAGE plot for 32 proteins (isoelectric point calculated using IPC2_protein)
Get csv file with sequences according to given criteria:
* You can choose from 21 different methods for calculating isoelectric point
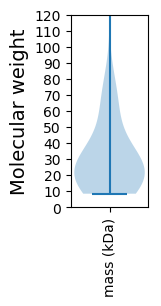
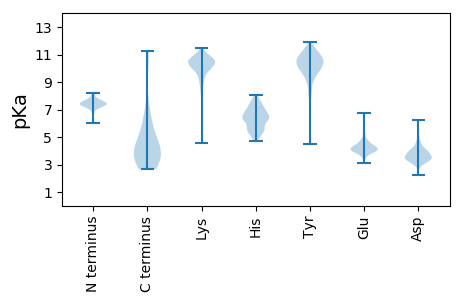
Summary statistics related to proteome-wise predictions


Protein with the lowest isoelectric point:
>tr|Q9G0H9|Q9G0H9_9CAUD Gp6 OS=Roseobacter virus SIO1 OX=136084 PE=4 SV=1
MM1 pKa = 7.59AKK3 pKa = 10.07KK4 pKa = 8.81PTVTTLQSGFNSTEE18 pKa = 3.71VLNEE22 pKa = 3.53NFEE25 pKa = 4.63NIRR28 pKa = 11.84DD29 pKa = 3.92AFDD32 pKa = 3.28NTLSLDD38 pKa = 3.47GSTPNAMQADD48 pKa = 4.36LDD50 pKa = 4.5LNGNNLIGATGLLINGTDD68 pKa = 3.54YY69 pKa = 11.46LADD72 pKa = 3.58VEE74 pKa = 4.35AAKK77 pKa = 10.42AAALVAQAAAEE88 pKa = 3.93LAEE91 pKa = 4.56NNAEE95 pKa = 4.13TAEE98 pKa = 4.25VNAEE102 pKa = 3.92ASEE105 pKa = 4.27TAAGLSATAAATSATNAGASEE126 pKa = 4.25TAASASATASATSATNSATSASQAATSASAAAVSEE161 pKa = 4.53GNAATSEE168 pKa = 4.27TNAANSATSASGSASTATTQASAASVSATNAATSASNAATSATNAAASQAAAATSEE224 pKa = 4.33TNAAASEE231 pKa = 4.56STVTTSATNAATSEE245 pKa = 4.17ANAATSASTATTQATNAATSASTASTSATNAATSEE280 pKa = 4.26TNAASSASSAASSATSAQASKK301 pKa = 10.94DD302 pKa = 3.5AALAALDD309 pKa = 4.23SFDD312 pKa = 5.84DD313 pKa = 4.2RR314 pKa = 11.84YY315 pKa = 11.02LGQKK319 pKa = 10.02VSDD322 pKa = 3.76PTLDD326 pKa = 3.37NDD328 pKa = 4.41GNALVAGALYY338 pKa = 10.7FNTTDD343 pKa = 4.63GIMKK347 pKa = 10.1VYY349 pKa = 10.58DD350 pKa = 3.62GSVWLAAYY358 pKa = 9.86ASLSGALIATNNLSDD373 pKa = 4.02VLDD376 pKa = 3.9VTASRR381 pKa = 11.84TNLGLGTAATTASTDD396 pKa = 3.38YY397 pKa = 10.08ATAAQGALAVSAVQPNDD414 pKa = 3.4SPSFGSVTVTGTVDD428 pKa = 3.38GRR430 pKa = 11.84NVAADD435 pKa = 3.79GSKK438 pKa = 10.81LDD440 pKa = 4.7GIEE443 pKa = 4.38AGATADD449 pKa = 3.53QTASEE454 pKa = 4.59ILTSIKK460 pKa = 9.85TVDD463 pKa = 3.58GSGSGLDD470 pKa = 3.96ADD472 pKa = 4.95LLDD475 pKa = 5.53GIHH478 pKa = 6.98ASSFLQGNQTITLSGDD494 pKa = 3.19VSGSGTTSILVTVADD509 pKa = 4.96DD510 pKa = 3.67SHH512 pKa = 7.71NHH514 pKa = 6.49IIANVDD520 pKa = 3.53GLQTALDD527 pKa = 4.28GKK529 pKa = 8.65WSKK532 pKa = 10.91GADD535 pKa = 2.97IGGGCC540 pKa = 4.62
MM1 pKa = 7.59AKK3 pKa = 10.07KK4 pKa = 8.81PTVTTLQSGFNSTEE18 pKa = 3.71VLNEE22 pKa = 3.53NFEE25 pKa = 4.63NIRR28 pKa = 11.84DD29 pKa = 3.92AFDD32 pKa = 3.28NTLSLDD38 pKa = 3.47GSTPNAMQADD48 pKa = 4.36LDD50 pKa = 4.5LNGNNLIGATGLLINGTDD68 pKa = 3.54YY69 pKa = 11.46LADD72 pKa = 3.58VEE74 pKa = 4.35AAKK77 pKa = 10.42AAALVAQAAAEE88 pKa = 3.93LAEE91 pKa = 4.56NNAEE95 pKa = 4.13TAEE98 pKa = 4.25VNAEE102 pKa = 3.92ASEE105 pKa = 4.27TAAGLSATAAATSATNAGASEE126 pKa = 4.25TAASASATASATSATNSATSASQAATSASAAAVSEE161 pKa = 4.53GNAATSEE168 pKa = 4.27TNAANSATSASGSASTATTQASAASVSATNAATSASNAATSATNAAASQAAAATSEE224 pKa = 4.33TNAAASEE231 pKa = 4.56STVTTSATNAATSEE245 pKa = 4.17ANAATSASTATTQATNAATSASTASTSATNAATSEE280 pKa = 4.26TNAASSASSAASSATSAQASKK301 pKa = 10.94DD302 pKa = 3.5AALAALDD309 pKa = 4.23SFDD312 pKa = 5.84DD313 pKa = 4.2RR314 pKa = 11.84YY315 pKa = 11.02LGQKK319 pKa = 10.02VSDD322 pKa = 3.76PTLDD326 pKa = 3.37NDD328 pKa = 4.41GNALVAGALYY338 pKa = 10.7FNTTDD343 pKa = 4.63GIMKK347 pKa = 10.1VYY349 pKa = 10.58DD350 pKa = 3.62GSVWLAAYY358 pKa = 9.86ASLSGALIATNNLSDD373 pKa = 4.02VLDD376 pKa = 3.9VTASRR381 pKa = 11.84TNLGLGTAATTASTDD396 pKa = 3.38YY397 pKa = 10.08ATAAQGALAVSAVQPNDD414 pKa = 3.4SPSFGSVTVTGTVDD428 pKa = 3.38GRR430 pKa = 11.84NVAADD435 pKa = 3.79GSKK438 pKa = 10.81LDD440 pKa = 4.7GIEE443 pKa = 4.38AGATADD449 pKa = 3.53QTASEE454 pKa = 4.59ILTSIKK460 pKa = 9.85TVDD463 pKa = 3.58GSGSGLDD470 pKa = 3.96ADD472 pKa = 4.95LLDD475 pKa = 5.53GIHH478 pKa = 6.98ASSFLQGNQTITLSGDD494 pKa = 3.19VSGSGTTSILVTVADD509 pKa = 4.96DD510 pKa = 3.67SHH512 pKa = 7.71NHH514 pKa = 6.49IIANVDD520 pKa = 3.53GLQTALDD527 pKa = 4.28GKK529 pKa = 8.65WSKK532 pKa = 10.91GADD535 pKa = 2.97IGGGCC540 pKa = 4.62
Molecular weight: 51.94 kDa
Isoelectric point according different methods:
Protein with the highest isoelectric point:
>tr|Q9G0G0|Q9G0G0_9CAUD Gp26 OS=Roseobacter virus SIO1 OX=136084 PE=4 SV=1
MM1 pKa = 6.89VAVTGTVLAIAGTTAGIVGTVKK23 pKa = 10.38AGKK26 pKa = 9.39AARR29 pKa = 11.84RR30 pKa = 11.84SARR33 pKa = 11.84AQQQAQEE40 pKa = 4.3VQAKK44 pKa = 7.43RR45 pKa = 11.84QRR47 pKa = 11.84RR48 pKa = 11.84AAIRR52 pKa = 11.84SNILASARR60 pKa = 11.84AKK62 pKa = 10.75ASAQAAGTSQSSGLSGAIGAGRR84 pKa = 11.84SQLGAEE90 pKa = 4.6LGFGSQLSGLSANISKK106 pKa = 10.58FDD108 pKa = 3.76MQAQTYY114 pKa = 10.64GDD116 pKa = 3.44IAKK119 pKa = 10.27LGFSAAGNAPTIGGYY134 pKa = 10.56AEE136 pKa = 4.31DD137 pKa = 4.6LYY139 pKa = 11.68GFFKK143 pKa = 10.87KK144 pKa = 10.54
MM1 pKa = 6.89VAVTGTVLAIAGTTAGIVGTVKK23 pKa = 10.38AGKK26 pKa = 9.39AARR29 pKa = 11.84RR30 pKa = 11.84SARR33 pKa = 11.84AQQQAQEE40 pKa = 4.3VQAKK44 pKa = 7.43RR45 pKa = 11.84QRR47 pKa = 11.84RR48 pKa = 11.84AAIRR52 pKa = 11.84SNILASARR60 pKa = 11.84AKK62 pKa = 10.75ASAQAAGTSQSSGLSGAIGAGRR84 pKa = 11.84SQLGAEE90 pKa = 4.6LGFGSQLSGLSANISKK106 pKa = 10.58FDD108 pKa = 3.76MQAQTYY114 pKa = 10.64GDD116 pKa = 3.44IAKK119 pKa = 10.27LGFSAAGNAPTIGGYY134 pKa = 10.56AEE136 pKa = 4.31DD137 pKa = 4.6LYY139 pKa = 11.68GFFKK143 pKa = 10.87KK144 pKa = 10.54
Molecular weight: 14.47 kDa
Isoelectric point according different methods:
Peptides (in silico digests for buttom-up proteomics)
Below you can find in silico digests of the whole proteome with Trypsin, Chymotrypsin, Trypsin+LysC, LysN, ArgC proteases suitable for different mass spec machines.| Try ESI |
 |
|---|
| ChTry ESI |
 |
|---|
| ArgC ESI |
 |
|---|
| LysN ESI |
 |
|---|
| TryLysC ESI |
 |
|---|
| Try MALDI |
 |
|---|
| ChTry MALDI |
 |
|---|
| ArgC MALDI |
 |
|---|
| LysN MALDI |
 |
|---|
| TryLysC MALDI |
 |
|---|
| Try LTQ |
 |
|---|
| ChTry LTQ |
 |
|---|
| ArgC LTQ |
 |
|---|
| LysN LTQ |
 |
|---|
| TryLysC LTQ |
 |
|---|
| Try MSlow |
 |
|---|
| ChTry MSlow |
 |
|---|
| ArgC MSlow |
 |
|---|
| LysN MSlow |
 |
|---|
| TryLysC MSlow |
 |
|---|
| Try MShigh |
 |
|---|
| ChTry MShigh |
 |
|---|
| ArgC MShigh |
 |
|---|
| LysN MShigh |
 |
|---|
| TryLysC MShigh |
 |
|---|
General Statistics
Number of major isoforms |
Number of additional isoforms |
Number of all proteins |
Number of amino acids |
Min. Seq. Length |
Max. Seq. Length |
Avg. Seq. Length |
Avg. Mol. Weight |
|---|---|---|---|---|---|---|---|
0 |
9898 |
77 |
1484 |
309.3 |
34.08 |
Amino acid frequency
Ala |
Cys |
Asp |
Glu |
Phe |
Gly |
His |
Ile |
Lys |
Leu |
|---|---|---|---|---|---|---|---|---|---|
9.547 ± 0.936 | 0.808 ± 0.205 |
6.486 ± 0.261 | 6.466 ± 0.35 |
3.91 ± 0.247 | 7.577 ± 0.318 |
1.475 ± 0.208 | 4.607 ± 0.304 |
6.274 ± 0.381 | 7.961 ± 0.214 |
Met |
Asn |
Gln |
Pro |
Arg |
Ser |
Thr |
Val |
Trp |
Tyr |
|---|---|---|---|---|---|---|---|---|---|
2.273 ± 0.187 | 4.86 ± 0.284 |
3.081 ± 0.195 | 3.566 ± 0.22 |
4.799 ± 0.32 | 7.577 ± 0.543 |
6.86 ± 0.45 | 6.951 ± 0.323 |
1.273 ± 0.182 | 3.637 ± 0.354 |
Most of the basic statistics you can see at this page can be downloaded from this CSV file
Proteome-pI is available under Creative Commons Attribution-NoDerivs license, for more details see here
| Reference: Kozlowski LP. Proteome-pI 2.0: Proteome Isoelectric Point Database Update. Nucleic Acids Res. 2021, doi: 10.1093/nar/gkab944 | Contact: Lukasz P. Kozlowski |
