Vibrio genomosp. F6 str. FF-238
Taxonomy: cellular organisms; Bacteria; Proteobacteria; Gammaproteobacteria; Vibrionales; Vibrionaceae; Vibrio; Vibrio genomosp. F6
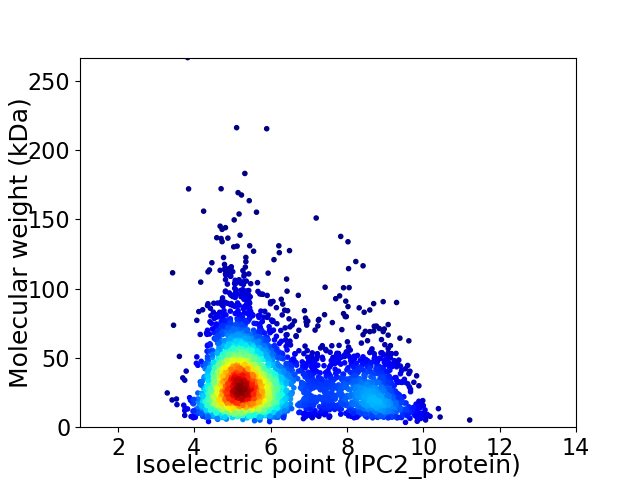
Average proteome isoelectric point is 6.03
Get precalculated fractions of proteins

Virtual 2D-PAGE plot for 3650 proteins (isoelectric point calculated using IPC2_protein)
Get csv file with sequences according to given criteria:
* You can choose from 21 different methods for calculating isoelectric point
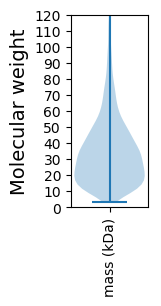
Summary statistics related to proteome-wise predictions


Protein with the lowest isoelectric point:
>tr|A0A1E5D724|A0A1E5D724_9VIBR ATP-binding protein Uup OS=Vibrio genomosp. F6 str. FF-238 OX=1191298 GN=uup PE=3 SV=1
MM1 pKa = 7.61KK2 pKa = 8.94KK3 pKa = 8.34TLVALAIAAVSTSAFAAEE21 pKa = 4.38TSSQNAKK28 pKa = 10.52PMFEE32 pKa = 4.62FDD34 pKa = 4.95PMHH37 pKa = 7.14KK38 pKa = 10.44DD39 pKa = 3.1QFSVSGAWGVGGYY52 pKa = 10.7YY53 pKa = 9.42DD54 pKa = 3.89TEE56 pKa = 4.01TDD58 pKa = 3.85AVYY61 pKa = 10.98DD62 pKa = 3.81DD63 pKa = 4.08WATGLTLAVNYY74 pKa = 9.97QNNRR78 pKa = 11.84FLGYY82 pKa = 10.4VEE84 pKa = 5.2VDD86 pKa = 3.15LEE88 pKa = 4.45MNYY91 pKa = 8.83STDD94 pKa = 3.3EE95 pKa = 4.16SKK97 pKa = 11.25KK98 pKa = 10.55DD99 pKa = 3.43IQSGPGTDD107 pKa = 5.39LDD109 pKa = 4.03KK110 pKa = 11.42AWIGFEE116 pKa = 3.95TGAGVLSFGWEE127 pKa = 3.66NDD129 pKa = 3.39TALDD133 pKa = 3.87KK134 pKa = 11.56VDD136 pKa = 3.69GKK138 pKa = 11.59GDD140 pKa = 3.32NTYY143 pKa = 11.1EE144 pKa = 4.3FGASAGDD151 pKa = 3.58ASDD154 pKa = 3.95GYY156 pKa = 11.49NVIKK160 pKa = 10.44FQGATSGIAYY170 pKa = 8.33GISMSEE176 pKa = 3.96TSDD179 pKa = 3.39DD180 pKa = 3.57RR181 pKa = 11.84TEE183 pKa = 4.5ADD185 pKa = 3.08SAYY188 pKa = 10.33NGYY191 pKa = 10.42VGLEE195 pKa = 3.43QDD197 pKa = 4.02TFNLYY202 pKa = 10.56AGYY205 pKa = 7.57EE206 pKa = 4.09TRR208 pKa = 11.84ADD210 pKa = 3.12ADD212 pKa = 3.99YY213 pKa = 11.57NVISVSGNVNLGEE226 pKa = 4.15LTLGANVWSNEE237 pKa = 3.76GADD240 pKa = 3.66DD241 pKa = 4.7VADD244 pKa = 3.39NTTNLKK250 pKa = 10.36EE251 pKa = 3.44IGYY254 pKa = 8.74YY255 pKa = 10.4VSGAYY260 pKa = 8.78PVSEE264 pKa = 4.62ALTLAAGYY272 pKa = 10.7AGGTVEE278 pKa = 5.16EE279 pKa = 5.33DD280 pKa = 2.78ATADD284 pKa = 2.99IDD286 pKa = 3.72ASYY289 pKa = 11.17FNVAAMYY296 pKa = 9.67TMSDD300 pKa = 3.54RR301 pKa = 11.84VDD303 pKa = 3.11MGIDD307 pKa = 2.99IRR309 pKa = 11.84RR310 pKa = 11.84DD311 pKa = 3.09LDD313 pKa = 3.67VPAGNDD319 pKa = 2.9EE320 pKa = 4.09EE321 pKa = 5.26TYY323 pKa = 10.75VFAAAFYY330 pKa = 10.91SFF332 pKa = 4.34
MM1 pKa = 7.61KK2 pKa = 8.94KK3 pKa = 8.34TLVALAIAAVSTSAFAAEE21 pKa = 4.38TSSQNAKK28 pKa = 10.52PMFEE32 pKa = 4.62FDD34 pKa = 4.95PMHH37 pKa = 7.14KK38 pKa = 10.44DD39 pKa = 3.1QFSVSGAWGVGGYY52 pKa = 10.7YY53 pKa = 9.42DD54 pKa = 3.89TEE56 pKa = 4.01TDD58 pKa = 3.85AVYY61 pKa = 10.98DD62 pKa = 3.81DD63 pKa = 4.08WATGLTLAVNYY74 pKa = 9.97QNNRR78 pKa = 11.84FLGYY82 pKa = 10.4VEE84 pKa = 5.2VDD86 pKa = 3.15LEE88 pKa = 4.45MNYY91 pKa = 8.83STDD94 pKa = 3.3EE95 pKa = 4.16SKK97 pKa = 11.25KK98 pKa = 10.55DD99 pKa = 3.43IQSGPGTDD107 pKa = 5.39LDD109 pKa = 4.03KK110 pKa = 11.42AWIGFEE116 pKa = 3.95TGAGVLSFGWEE127 pKa = 3.66NDD129 pKa = 3.39TALDD133 pKa = 3.87KK134 pKa = 11.56VDD136 pKa = 3.69GKK138 pKa = 11.59GDD140 pKa = 3.32NTYY143 pKa = 11.1EE144 pKa = 4.3FGASAGDD151 pKa = 3.58ASDD154 pKa = 3.95GYY156 pKa = 11.49NVIKK160 pKa = 10.44FQGATSGIAYY170 pKa = 8.33GISMSEE176 pKa = 3.96TSDD179 pKa = 3.39DD180 pKa = 3.57RR181 pKa = 11.84TEE183 pKa = 4.5ADD185 pKa = 3.08SAYY188 pKa = 10.33NGYY191 pKa = 10.42VGLEE195 pKa = 3.43QDD197 pKa = 4.02TFNLYY202 pKa = 10.56AGYY205 pKa = 7.57EE206 pKa = 4.09TRR208 pKa = 11.84ADD210 pKa = 3.12ADD212 pKa = 3.99YY213 pKa = 11.57NVISVSGNVNLGEE226 pKa = 4.15LTLGANVWSNEE237 pKa = 3.76GADD240 pKa = 3.66DD241 pKa = 4.7VADD244 pKa = 3.39NTTNLKK250 pKa = 10.36EE251 pKa = 3.44IGYY254 pKa = 8.74YY255 pKa = 10.4VSGAYY260 pKa = 8.78PVSEE264 pKa = 4.62ALTLAAGYY272 pKa = 10.7AGGTVEE278 pKa = 5.16EE279 pKa = 5.33DD280 pKa = 2.78ATADD284 pKa = 2.99IDD286 pKa = 3.72ASYY289 pKa = 11.17FNVAAMYY296 pKa = 9.67TMSDD300 pKa = 3.54RR301 pKa = 11.84VDD303 pKa = 3.11MGIDD307 pKa = 2.99IRR309 pKa = 11.84RR310 pKa = 11.84DD311 pKa = 3.09LDD313 pKa = 3.67VPAGNDD319 pKa = 2.9EE320 pKa = 4.09EE321 pKa = 5.26TYY323 pKa = 10.75VFAAAFYY330 pKa = 10.91SFF332 pKa = 4.34
Molecular weight: 35.59 kDa
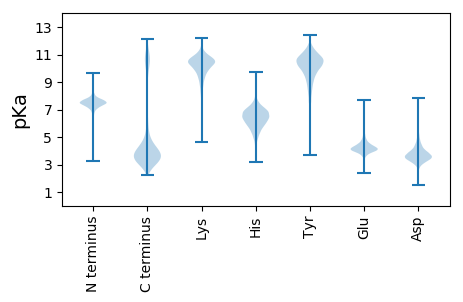
Isoelectric point according different methods:
Protein with the highest isoelectric point:
>tr|A0A1E5CYD5|A0A1E5CYD5_9VIBR ABC transporter permease OS=Vibrio genomosp. F6 str. FF-238 OX=1191298 GN=A130_00565 PE=3 SV=1
MM1 pKa = 7.45KK2 pKa = 9.5RR3 pKa = 11.84TFQPTVLKK11 pKa = 10.35RR12 pKa = 11.84KK13 pKa = 9.02RR14 pKa = 11.84SHH16 pKa = 6.15GFRR19 pKa = 11.84ARR21 pKa = 11.84MATKK25 pKa = 10.44NGRR28 pKa = 11.84ATINARR34 pKa = 11.84RR35 pKa = 11.84AKK37 pKa = 9.74GRR39 pKa = 11.84KK40 pKa = 8.91RR41 pKa = 11.84LSKK44 pKa = 10.84
MM1 pKa = 7.45KK2 pKa = 9.5RR3 pKa = 11.84TFQPTVLKK11 pKa = 10.35RR12 pKa = 11.84KK13 pKa = 9.02RR14 pKa = 11.84SHH16 pKa = 6.15GFRR19 pKa = 11.84ARR21 pKa = 11.84MATKK25 pKa = 10.44NGRR28 pKa = 11.84ATINARR34 pKa = 11.84RR35 pKa = 11.84AKK37 pKa = 9.74GRR39 pKa = 11.84KK40 pKa = 8.91RR41 pKa = 11.84LSKK44 pKa = 10.84
Molecular weight: 5.17 kDa
Isoelectric point according different methods:
Peptides (in silico digests for buttom-up proteomics)
Below you can find in silico digests of the whole proteome with Trypsin, Chymotrypsin, Trypsin+LysC, LysN, ArgC proteases suitable for different mass spec machines.| Try ESI |
 |
|---|
| ChTry ESI |
 |
|---|
| ArgC ESI |
 |
|---|
| LysN ESI |
 |
|---|
| TryLysC ESI |
 |
|---|
| Try MALDI |
 |
|---|
| ChTry MALDI |
 |
|---|
| ArgC MALDI |
 |
|---|
| LysN MALDI |
 |
|---|
| TryLysC MALDI |
 |
|---|
| Try LTQ |
 |
|---|
| ChTry LTQ |
 |
|---|
| ArgC LTQ |
 |
|---|
| LysN LTQ |
 |
|---|
| TryLysC LTQ |
 |
|---|
| Try MSlow |
 |
|---|
| ChTry MSlow |
 |
|---|
| ArgC MSlow |
 |
|---|
| LysN MSlow |
 |
|---|
| TryLysC MSlow |
 |
|---|
| Try MShigh |
 |
|---|
| ChTry MShigh |
 |
|---|
| ArgC MShigh |
 |
|---|
| LysN MShigh |
 |
|---|
| TryLysC MShigh |
 |
|---|
General Statistics
Number of major isoforms |
Number of additional isoforms |
Number of all proteins |
Number of amino acids |
Min. Seq. Length |
Max. Seq. Length |
Avg. Seq. Length |
Avg. Mol. Weight |
|---|---|---|---|---|---|---|---|
0 |
1184933 |
30 |
2423 |
324.6 |
36.12 |
Amino acid frequency
Ala |
Cys |
Asp |
Glu |
Phe |
Gly |
His |
Ile |
Lys |
Leu |
|---|---|---|---|---|---|---|---|---|---|
8.179 ± 0.04 | 1.047 ± 0.013 |
5.599 ± 0.038 | 6.432 ± 0.042 |
4.181 ± 0.031 | 6.667 ± 0.036 |
2.234 ± 0.021 | 6.631 ± 0.033 |
5.53 ± 0.038 | 10.278 ± 0.047 |
Met |
Asn |
Gln |
Pro |
Arg |
Ser |
Thr |
Val |
Trp |
Tyr |
|---|---|---|---|---|---|---|---|---|---|
2.697 ± 0.018 | 4.386 ± 0.029 |
3.781 ± 0.023 | 4.524 ± 0.037 |
4.36 ± 0.028 | 6.996 ± 0.04 |
5.351 ± 0.023 | 6.908 ± 0.033 |
1.208 ± 0.015 | 3.012 ± 0.023 |
Most of the basic statistics you can see at this page can be downloaded from this CSV file
Proteome-pI is available under Creative Commons Attribution-NoDerivs license, for more details see here
| Reference: Kozlowski LP. Proteome-pI 2.0: Proteome Isoelectric Point Database Update. Nucleic Acids Res. 2021, doi: 10.1093/nar/gkab944 | Contact: Lukasz P. Kozlowski |
