Tateyamaria sp. ANG-S1
Taxonomy: cellular organisms; Bacteria; Proteobacteria; Alphaproteobacteria; Rhodobacterales; Roseobacteraceae; Tateyamaria; unclassified Tateyamaria
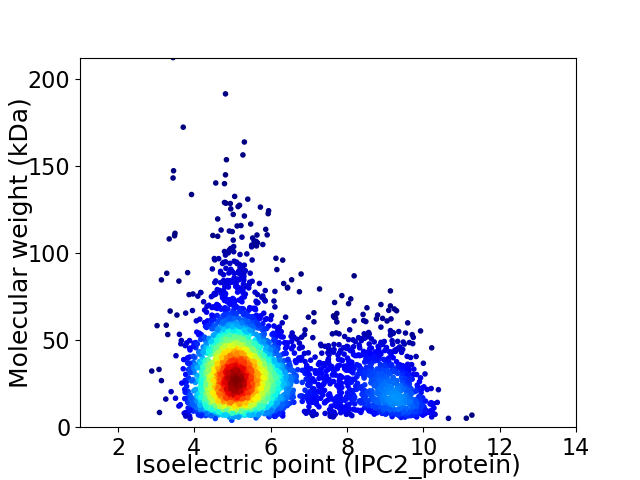
Average proteome isoelectric point is 5.94
Get precalculated fractions of proteins

Virtual 2D-PAGE plot for 3983 proteins (isoelectric point calculated using IPC2_protein)
Get csv file with sequences according to given criteria:
* You can choose from 21 different methods for calculating isoelectric point
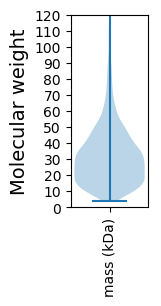
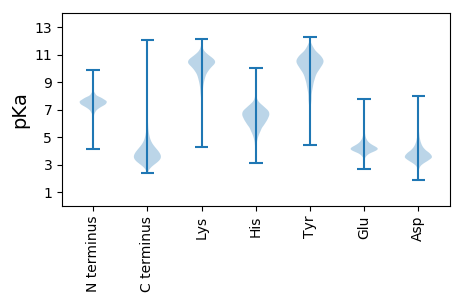
Summary statistics related to proteome-wise predictions


Protein with the lowest isoelectric point:
>tr|A0A0B4C986|A0A0B4C986_9RHOB Aspartate aminotransferase OS=Tateyamaria sp. ANG-S1 OX=1577905 GN=RA29_13010 PE=3 SV=1
MM1 pKa = 7.2KK2 pKa = 9.99TRR4 pKa = 11.84ILAIGLAAALAGPALAGSLEE24 pKa = 4.26PPAPEE29 pKa = 4.13PAAPAPLPPAPVQSFGGDD47 pKa = 2.96WTGGYY52 pKa = 10.56AGLQLGYY59 pKa = 10.89GDD61 pKa = 4.1VDD63 pKa = 3.58GSGAADD69 pKa = 3.92GDD71 pKa = 4.05DD72 pKa = 4.15FLYY75 pKa = 10.44GAHH78 pKa = 5.98VGYY81 pKa = 10.32RR82 pKa = 11.84YY83 pKa = 10.77DD84 pKa = 3.4FGTFVLGGEE93 pKa = 4.45LDD95 pKa = 3.65YY96 pKa = 11.77DD97 pKa = 4.34FADD100 pKa = 3.63IDD102 pKa = 4.37LNGAASVDD110 pKa = 3.63SVARR114 pKa = 11.84LKK116 pKa = 11.12LQGGYY121 pKa = 11.0DD122 pKa = 3.96FGRR125 pKa = 11.84TLAYY129 pKa = 7.85FTAGLAEE136 pKa = 4.29VDD138 pKa = 3.45TSLGSEE144 pKa = 3.72SGEE147 pKa = 3.95FYY149 pKa = 10.98GIGVAYY155 pKa = 9.72QINDD159 pKa = 3.67RR160 pKa = 11.84YY161 pKa = 8.6TVGAEE166 pKa = 3.99LLDD169 pKa = 4.54HH170 pKa = 6.79NFDD173 pKa = 5.56DD174 pKa = 4.94INGTGVDD181 pKa = 3.93ADD183 pKa = 3.7ATTLTVRR190 pKa = 11.84GSINFF195 pKa = 3.49
MM1 pKa = 7.2KK2 pKa = 9.99TRR4 pKa = 11.84ILAIGLAAALAGPALAGSLEE24 pKa = 4.26PPAPEE29 pKa = 4.13PAAPAPLPPAPVQSFGGDD47 pKa = 2.96WTGGYY52 pKa = 10.56AGLQLGYY59 pKa = 10.89GDD61 pKa = 4.1VDD63 pKa = 3.58GSGAADD69 pKa = 3.92GDD71 pKa = 4.05DD72 pKa = 4.15FLYY75 pKa = 10.44GAHH78 pKa = 5.98VGYY81 pKa = 10.32RR82 pKa = 11.84YY83 pKa = 10.77DD84 pKa = 3.4FGTFVLGGEE93 pKa = 4.45LDD95 pKa = 3.65YY96 pKa = 11.77DD97 pKa = 4.34FADD100 pKa = 3.63IDD102 pKa = 4.37LNGAASVDD110 pKa = 3.63SVARR114 pKa = 11.84LKK116 pKa = 11.12LQGGYY121 pKa = 11.0DD122 pKa = 3.96FGRR125 pKa = 11.84TLAYY129 pKa = 7.85FTAGLAEE136 pKa = 4.29VDD138 pKa = 3.45TSLGSEE144 pKa = 3.72SGEE147 pKa = 3.95FYY149 pKa = 10.98GIGVAYY155 pKa = 9.72QINDD159 pKa = 3.67RR160 pKa = 11.84YY161 pKa = 8.6TVGAEE166 pKa = 3.99LLDD169 pKa = 4.54HH170 pKa = 6.79NFDD173 pKa = 5.56DD174 pKa = 4.94INGTGVDD181 pKa = 3.93ADD183 pKa = 3.7ATTLTVRR190 pKa = 11.84GSINFF195 pKa = 3.49
Molecular weight: 20.06 kDa
Isoelectric point according different methods:
Protein with the highest isoelectric point:
>tr|A0A0B4BRS4|A0A0B4BRS4_9RHOB Uncharacterized protein OS=Tateyamaria sp. ANG-S1 OX=1577905 GN=RA29_06115 PE=3 SV=1
MM1 pKa = 7.31QSPGSTTVTLTRR13 pKa = 11.84RR14 pKa = 11.84SASAIAAASPAGPPPAIRR32 pKa = 11.84TSGIRR37 pKa = 11.84PRR39 pKa = 11.84PGPAARR45 pKa = 11.84MSVPQALRR53 pKa = 11.84RR54 pKa = 11.84RR55 pKa = 11.84RR56 pKa = 11.84LWVPRR61 pKa = 11.84VGRR64 pKa = 11.84ALL66 pKa = 3.5
MM1 pKa = 7.31QSPGSTTVTLTRR13 pKa = 11.84RR14 pKa = 11.84SASAIAAASPAGPPPAIRR32 pKa = 11.84TSGIRR37 pKa = 11.84PRR39 pKa = 11.84PGPAARR45 pKa = 11.84MSVPQALRR53 pKa = 11.84RR54 pKa = 11.84RR55 pKa = 11.84RR56 pKa = 11.84LWVPRR61 pKa = 11.84VGRR64 pKa = 11.84ALL66 pKa = 3.5
Molecular weight: 6.94 kDa
Isoelectric point according different methods:
Peptides (in silico digests for buttom-up proteomics)
Below you can find in silico digests of the whole proteome with Trypsin, Chymotrypsin, Trypsin+LysC, LysN, ArgC proteases suitable for different mass spec machines.| Try ESI |
 |
|---|
| ChTry ESI |
 |
|---|
| ArgC ESI |
 |
|---|
| LysN ESI |
 |
|---|
| TryLysC ESI |
 |
|---|
| Try MALDI |
 |
|---|
| ChTry MALDI |
 |
|---|
| ArgC MALDI |
 |
|---|
| LysN MALDI |
 |
|---|
| TryLysC MALDI |
 |
|---|
| Try LTQ |
 |
|---|
| ChTry LTQ |
 |
|---|
| ArgC LTQ |
 |
|---|
| LysN LTQ |
 |
|---|
| TryLysC LTQ |
 |
|---|
| Try MSlow |
 |
|---|
| ChTry MSlow |
 |
|---|
| ArgC MSlow |
 |
|---|
| LysN MSlow |
 |
|---|
| TryLysC MSlow |
 |
|---|
| Try MShigh |
 |
|---|
| ChTry MShigh |
 |
|---|
| ArgC MShigh |
 |
|---|
| LysN MShigh |
 |
|---|
| TryLysC MShigh |
 |
|---|
General Statistics
Number of major isoforms |
Number of additional isoforms |
Number of all proteins |
Number of amino acids |
Min. Seq. Length |
Max. Seq. Length |
Avg. Seq. Length |
Avg. Mol. Weight |
|---|---|---|---|---|---|---|---|
0 |
1214556 |
35 |
2088 |
304.9 |
33.1 |
Amino acid frequency
Ala |
Cys |
Asp |
Glu |
Phe |
Gly |
His |
Ile |
Lys |
Leu |
|---|---|---|---|---|---|---|---|---|---|
12.157 ± 0.056 | 0.871 ± 0.012 |
6.498 ± 0.044 | 5.66 ± 0.039 |
3.804 ± 0.027 | 8.614 ± 0.046 |
2.128 ± 0.019 | 5.216 ± 0.029 |
3.153 ± 0.035 | 9.763 ± 0.043 |
Met |
Asn |
Gln |
Pro |
Arg |
Ser |
Thr |
Val |
Trp |
Tyr |
|---|---|---|---|---|---|---|---|---|---|
2.905 ± 0.023 | 2.71 ± 0.026 |
4.98 ± 0.03 | 3.346 ± 0.021 |
6.27 ± 0.04 | 5.029 ± 0.026 |
5.808 ± 0.033 | 7.413 ± 0.031 |
1.434 ± 0.018 | 2.243 ± 0.018 |
Most of the basic statistics you can see at this page can be downloaded from this CSV file
Proteome-pI is available under Creative Commons Attribution-NoDerivs license, for more details see here
| Reference: Kozlowski LP. Proteome-pI 2.0: Proteome Isoelectric Point Database Update. Nucleic Acids Res. 2021, doi: 10.1093/nar/gkab944 | Contact: Lukasz P. Kozlowski |
