candidate division MSBL1 archaeon SCGC-AAA385M11
Taxonomy: cellular organisms; Archaea; Euryarchaeota; Euryarchaeota incertae sedis; candidate division MSBL1
Average proteome isoelectric point is 6.92
Get precalculated fractions of proteins

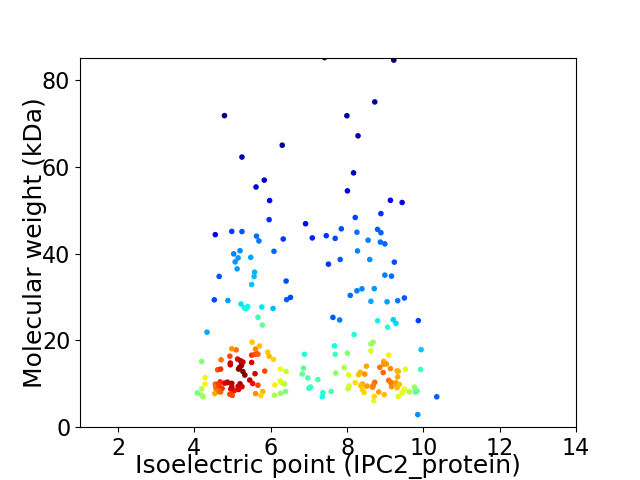
Virtual 2D-PAGE plot for 228 proteins (isoelectric point calculated using IPC2_protein)
Get csv file with sequences according to given criteria:
* You can choose from 21 different methods for calculating isoelectric point
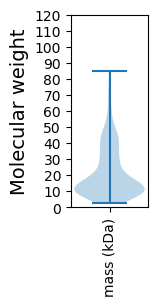
Summary statistics related to proteome-wise predictions


Protein with the lowest isoelectric point:
>tr|A0A133VRT6|A0A133VRT6_9EURY Uncharacterized protein (Fragment) OS=candidate division MSBL1 archaeon SCGC-AAA385M11 OX=1698288 GN=AKJ60_00925 PE=4 SV=1
MM1 pKa = 7.45QYY3 pKa = 11.39LNIKK7 pKa = 9.96IEE9 pKa = 4.14VFHH12 pKa = 7.3EE13 pKa = 4.74DD14 pKa = 3.37DD15 pKa = 5.49LYY17 pKa = 11.87VALCPNLNVSSYY29 pKa = 10.79GEE31 pKa = 4.16SVEE34 pKa = 4.17EE35 pKa = 3.87AKK37 pKa = 10.61KK38 pKa = 10.8ALIEE42 pKa = 4.06AVEE45 pKa = 4.31AFLEE49 pKa = 4.67EE50 pKa = 4.35CAEE53 pKa = 4.12MGTLEE58 pKa = 5.59DD59 pKa = 3.6VLEE62 pKa = 4.28EE63 pKa = 4.1CGYY66 pKa = 11.24SKK68 pKa = 11.18VNQTWQPRR76 pKa = 11.84QAVKK80 pKa = 10.66EE81 pKa = 3.92EE82 pKa = 4.22SLAVTII88 pKa = 5.26
MM1 pKa = 7.45QYY3 pKa = 11.39LNIKK7 pKa = 9.96IEE9 pKa = 4.14VFHH12 pKa = 7.3EE13 pKa = 4.74DD14 pKa = 3.37DD15 pKa = 5.49LYY17 pKa = 11.87VALCPNLNVSSYY29 pKa = 10.79GEE31 pKa = 4.16SVEE34 pKa = 4.17EE35 pKa = 3.87AKK37 pKa = 10.61KK38 pKa = 10.8ALIEE42 pKa = 4.06AVEE45 pKa = 4.31AFLEE49 pKa = 4.67EE50 pKa = 4.35CAEE53 pKa = 4.12MGTLEE58 pKa = 5.59DD59 pKa = 3.6VLEE62 pKa = 4.28EE63 pKa = 4.1CGYY66 pKa = 11.24SKK68 pKa = 11.18VNQTWQPRR76 pKa = 11.84QAVKK80 pKa = 10.66EE81 pKa = 3.92EE82 pKa = 4.22SLAVTII88 pKa = 5.26
Molecular weight: 9.94 kDa
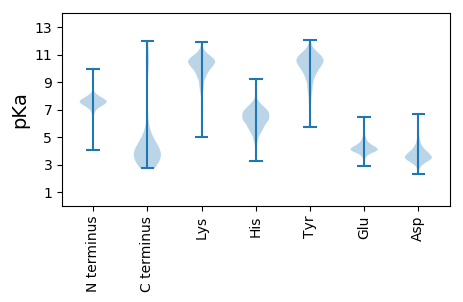
Isoelectric point according different methods:
Protein with the highest isoelectric point:
>tr|A0A133VSL1|A0A133VSL1_9EURY Cell division protein FtsZ OS=candidate division MSBL1 archaeon SCGC-AAA385M11 OX=1698288 GN=ftsZ PE=3 SV=1
MM1 pKa = 7.38SPNRR5 pKa = 11.84PSRR8 pKa = 11.84PVKK11 pKa = 10.19RR12 pKa = 11.84RR13 pKa = 11.84PGLVALGRR21 pKa = 11.84IARR24 pKa = 11.84SLFLVILLLGLSYY37 pKa = 11.56ALLRR41 pKa = 11.84GYY43 pKa = 10.49FWVTTLSCLALEE55 pKa = 4.39TVEE58 pKa = 4.25VRR60 pKa = 11.84GNHH63 pKa = 6.25RR64 pKa = 11.84FTDD67 pKa = 3.7QEE69 pKa = 4.06IMSLAGVEE77 pKa = 4.47VGDD80 pKa = 3.65NCLAISLGAVKK91 pKa = 10.23RR92 pKa = 11.84RR93 pKa = 11.84LSANPWLEE101 pKa = 3.99DD102 pKa = 3.28VLVRR106 pKa = 11.84RR107 pKa = 11.84VLPDD111 pKa = 3.15RR112 pKa = 11.84LEE114 pKa = 3.79IAVRR118 pKa = 11.84EE119 pKa = 4.09KK120 pKa = 10.84QAVFWIRR127 pKa = 11.84HH128 pKa = 5.43RR129 pKa = 11.84EE130 pKa = 3.87DD131 pKa = 3.57LYY133 pKa = 11.17YY134 pKa = 10.92AQADD138 pKa = 3.86GRR140 pKa = 11.84PIAPVEE146 pKa = 4.14AEE148 pKa = 4.31NFASLPLLTLPEE160 pKa = 4.4SNRR163 pKa = 11.84ASARR167 pKa = 11.84EE168 pKa = 3.84KK169 pKa = 10.76LNQVVKK175 pKa = 10.33WFTRR179 pKa = 11.84KK180 pKa = 8.7QAPFSLAEE188 pKa = 4.07LAWVRR193 pKa = 11.84FRR195 pKa = 11.84RR196 pKa = 11.84DD197 pKa = 3.91FILEE201 pKa = 4.15LYY203 pKa = 9.84LRR205 pKa = 11.84NDD207 pKa = 3.33RR208 pKa = 11.84GRR210 pKa = 11.84IRR212 pKa = 11.84VGLEE216 pKa = 3.58SLKK219 pKa = 11.09EE220 pKa = 3.94NLTVLTKK227 pKa = 9.86VWRR230 pKa = 11.84DD231 pKa = 3.08LEE233 pKa = 4.04QRR235 pKa = 11.84RR236 pKa = 11.84EE237 pKa = 4.05LRR239 pKa = 11.84EE240 pKa = 3.44MAKK243 pKa = 9.62IVVYY247 pKa = 10.86QRR249 pKa = 11.84MGWVGFSAGG258 pKa = 3.51
MM1 pKa = 7.38SPNRR5 pKa = 11.84PSRR8 pKa = 11.84PVKK11 pKa = 10.19RR12 pKa = 11.84RR13 pKa = 11.84PGLVALGRR21 pKa = 11.84IARR24 pKa = 11.84SLFLVILLLGLSYY37 pKa = 11.56ALLRR41 pKa = 11.84GYY43 pKa = 10.49FWVTTLSCLALEE55 pKa = 4.39TVEE58 pKa = 4.25VRR60 pKa = 11.84GNHH63 pKa = 6.25RR64 pKa = 11.84FTDD67 pKa = 3.7QEE69 pKa = 4.06IMSLAGVEE77 pKa = 4.47VGDD80 pKa = 3.65NCLAISLGAVKK91 pKa = 10.23RR92 pKa = 11.84RR93 pKa = 11.84LSANPWLEE101 pKa = 3.99DD102 pKa = 3.28VLVRR106 pKa = 11.84RR107 pKa = 11.84VLPDD111 pKa = 3.15RR112 pKa = 11.84LEE114 pKa = 3.79IAVRR118 pKa = 11.84EE119 pKa = 4.09KK120 pKa = 10.84QAVFWIRR127 pKa = 11.84HH128 pKa = 5.43RR129 pKa = 11.84EE130 pKa = 3.87DD131 pKa = 3.57LYY133 pKa = 11.17YY134 pKa = 10.92AQADD138 pKa = 3.86GRR140 pKa = 11.84PIAPVEE146 pKa = 4.14AEE148 pKa = 4.31NFASLPLLTLPEE160 pKa = 4.4SNRR163 pKa = 11.84ASARR167 pKa = 11.84EE168 pKa = 3.84KK169 pKa = 10.76LNQVVKK175 pKa = 10.33WFTRR179 pKa = 11.84KK180 pKa = 8.7QAPFSLAEE188 pKa = 4.07LAWVRR193 pKa = 11.84FRR195 pKa = 11.84RR196 pKa = 11.84DD197 pKa = 3.91FILEE201 pKa = 4.15LYY203 pKa = 9.84LRR205 pKa = 11.84NDD207 pKa = 3.33RR208 pKa = 11.84GRR210 pKa = 11.84IRR212 pKa = 11.84VGLEE216 pKa = 3.58SLKK219 pKa = 11.09EE220 pKa = 3.94NLTVLTKK227 pKa = 9.86VWRR230 pKa = 11.84DD231 pKa = 3.08LEE233 pKa = 4.04QRR235 pKa = 11.84RR236 pKa = 11.84EE237 pKa = 4.05LRR239 pKa = 11.84EE240 pKa = 3.44MAKK243 pKa = 9.62IVVYY247 pKa = 10.86QRR249 pKa = 11.84MGWVGFSAGG258 pKa = 3.51
Molecular weight: 29.77 kDa
Isoelectric point according different methods:
Peptides (in silico digests for buttom-up proteomics)
Below you can find in silico digests of the whole proteome with Trypsin, Chymotrypsin, Trypsin+LysC, LysN, ArgC proteases suitable for different mass spec machines.| Try ESI |
 |
|---|
| ChTry ESI |
 |
|---|
| ArgC ESI |
 |
|---|
| LysN ESI |
 |
|---|
| TryLysC ESI |
 |
|---|
| Try MALDI |
 |
|---|
| ChTry MALDI |
 |
|---|
| ArgC MALDI |
 |
|---|
| LysN MALDI |
 |
|---|
| TryLysC MALDI |
 |
|---|
| Try LTQ |
 |
|---|
| ChTry LTQ |
 |
|---|
| ArgC LTQ |
 |
|---|
| LysN LTQ |
 |
|---|
| TryLysC LTQ |
 |
|---|
| Try MSlow |
 |
|---|
| ChTry MSlow |
 |
|---|
| ArgC MSlow |
 |
|---|
| LysN MSlow |
 |
|---|
| TryLysC MSlow |
 |
|---|
| Try MShigh |
 |
|---|
| ChTry MShigh |
 |
|---|
| ArgC MShigh |
 |
|---|
| LysN MShigh |
 |
|---|
| TryLysC MShigh |
 |
|---|
General Statistics
Number of major isoforms |
Number of additional isoforms |
Number of all proteins |
Number of amino acids |
Min. Seq. Length |
Max. Seq. Length |
Avg. Seq. Length |
Avg. Mol. Weight |
|---|---|---|---|---|---|---|---|
0 |
43957 |
27 |
750 |
192.8 |
22.05 |
Amino acid frequency
Ala |
Cys |
Asp |
Glu |
Phe |
Gly |
His |
Ile |
Lys |
Leu |
|---|---|---|---|---|---|---|---|---|---|
6.584 ± 0.149 | 1.253 ± 0.062 |
5.276 ± 0.125 | 7.421 ± 0.202 |
4.655 ± 0.139 | 6.406 ± 0.156 |
2.248 ± 0.077 | 6.424 ± 0.126 |
6.795 ± 0.185 | 10.005 ± 0.174 |
Met |
Asn |
Gln |
Pro |
Arg |
Ser |
Thr |
Val |
Trp |
Tyr |
|---|---|---|---|---|---|---|---|---|---|
2.45 ± 0.085 | 4.084 ± 0.118 |
4.177 ± 0.11 | 4.259 ± 0.113 |
6.242 ± 0.152 | 6.142 ± 0.13 |
4.411 ± 0.09 | 5.892 ± 0.129 |
1.638 ± 0.089 | 3.638 ± 0.101 |
Most of the basic statistics you can see at this page can be downloaded from this CSV file
Proteome-pI is available under Creative Commons Attribution-NoDerivs license, for more details see here
| Reference: Kozlowski LP. Proteome-pI 2.0: Proteome Isoelectric Point Database Update. Nucleic Acids Res. 2021, doi: 10.1093/nar/gkab944 | Contact: Lukasz P. Kozlowski |
