Lachnospiraceae bacterium OF09-6
Taxonomy: cellular organisms; Bacteria; Terrabacteria group; Firmicutes; Clostridia; Eubacteriales; Lachnospiraceae; unclassified Lachnospiraceae
Average proteome isoelectric point is 6.07
Get precalculated fractions of proteins

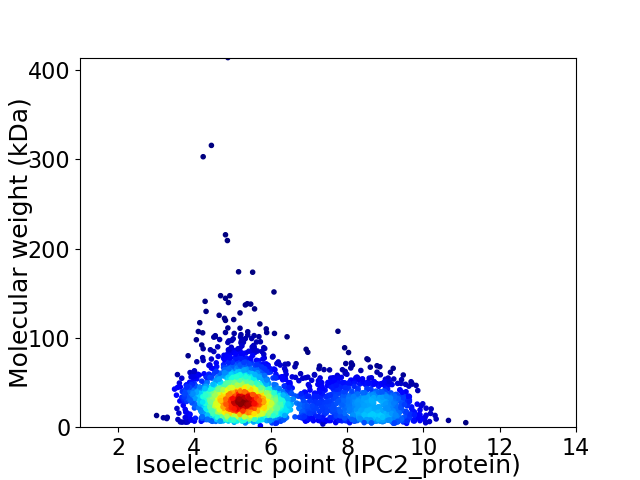
Virtual 2D-PAGE plot for 2857 proteins (isoelectric point calculated using IPC2_protein)
Get csv file with sequences according to given criteria:
* You can choose from 21 different methods for calculating isoelectric point
Summary statistics related to proteome-wise predictions


Protein with the lowest isoelectric point:
>tr|A0A373A895|A0A373A895_9FIRM ABC transporter permease OS=Lachnospiraceae bacterium OF09-6 OX=2293831 GN=DXA98_14905 PE=3 SV=1
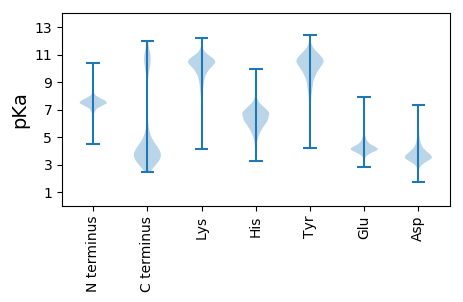
MM1 pKa = 7.08MKK3 pKa = 10.56KK4 pKa = 9.02LTVLAAAAMLAALPATGVSAAGDD27 pKa = 3.54LTFATGGSSGTYY39 pKa = 8.5YY40 pKa = 11.37AFGSVLAGEE49 pKa = 4.67VSSDD53 pKa = 3.02TDD55 pKa = 3.56TKK57 pKa = 9.73VTAVEE62 pKa = 4.64SNGSADD68 pKa = 4.62NVDD71 pKa = 3.59QVDD74 pKa = 4.39AGDD77 pKa = 4.18ADD79 pKa = 3.61IAFCQSDD86 pKa = 3.93VMAYY90 pKa = 10.2AHH92 pKa = 7.16DD93 pKa = 5.0GINLFEE99 pKa = 5.27GDD101 pKa = 4.74PIDD104 pKa = 4.48SFSTVAALYY113 pKa = 9.91QEE115 pKa = 4.28QVQIITTNPDD125 pKa = 2.64IKK127 pKa = 10.06TVADD131 pKa = 3.87LKK133 pKa = 10.95GKK135 pKa = 9.65NVSIGASGSGVYY147 pKa = 9.97FNAIDD152 pKa = 4.07LLNAYY157 pKa = 9.54GLTEE161 pKa = 3.98EE162 pKa = 5.68DD163 pKa = 3.39INPTYY168 pKa = 10.88EE169 pKa = 4.07SFADD173 pKa = 3.73SADD176 pKa = 3.51SLKK179 pKa = 10.95DD180 pKa = 3.49GKK182 pKa = 10.36IDD184 pKa = 3.6AAFITSGAPTTAVTDD199 pKa = 4.14LGTAKK204 pKa = 10.32DD205 pKa = 3.94VYY207 pKa = 10.63LVSIDD212 pKa = 4.02DD213 pKa = 3.79EE214 pKa = 4.54HH215 pKa = 6.67MKK217 pKa = 9.76TLLEE221 pKa = 4.07EE222 pKa = 4.25CPYY225 pKa = 9.28YY226 pKa = 10.66TEE228 pKa = 4.27NTISADD234 pKa = 3.49TYY236 pKa = 11.74GLDD239 pKa = 3.58EE240 pKa = 4.69DD241 pKa = 4.6VKK243 pKa = 9.03TVAVGAVVIASNDD256 pKa = 3.35VAEE259 pKa = 4.43DD260 pKa = 4.29DD261 pKa = 3.9IYY263 pKa = 11.75NFVSAVFEE271 pKa = 4.08NTDD274 pKa = 3.85AIEE277 pKa = 4.01TAHH280 pKa = 6.97AKK282 pKa = 9.97GAEE285 pKa = 3.98LDD287 pKa = 3.53LDD289 pKa = 3.98YY290 pKa = 11.03AASITSVPYY299 pKa = 9.78HH300 pKa = 6.72AGAAKK305 pKa = 10.09YY306 pKa = 10.15FEE308 pKa = 4.68EE309 pKa = 5.18KK310 pKa = 10.72GLTVEE315 pKa = 4.72TEE317 pKa = 3.79
MM1 pKa = 7.08MKK3 pKa = 10.56KK4 pKa = 9.02LTVLAAAAMLAALPATGVSAAGDD27 pKa = 3.54LTFATGGSSGTYY39 pKa = 8.5YY40 pKa = 11.37AFGSVLAGEE49 pKa = 4.67VSSDD53 pKa = 3.02TDD55 pKa = 3.56TKK57 pKa = 9.73VTAVEE62 pKa = 4.64SNGSADD68 pKa = 4.62NVDD71 pKa = 3.59QVDD74 pKa = 4.39AGDD77 pKa = 4.18ADD79 pKa = 3.61IAFCQSDD86 pKa = 3.93VMAYY90 pKa = 10.2AHH92 pKa = 7.16DD93 pKa = 5.0GINLFEE99 pKa = 5.27GDD101 pKa = 4.74PIDD104 pKa = 4.48SFSTVAALYY113 pKa = 9.91QEE115 pKa = 4.28QVQIITTNPDD125 pKa = 2.64IKK127 pKa = 10.06TVADD131 pKa = 3.87LKK133 pKa = 10.95GKK135 pKa = 9.65NVSIGASGSGVYY147 pKa = 9.97FNAIDD152 pKa = 4.07LLNAYY157 pKa = 9.54GLTEE161 pKa = 3.98EE162 pKa = 5.68DD163 pKa = 3.39INPTYY168 pKa = 10.88EE169 pKa = 4.07SFADD173 pKa = 3.73SADD176 pKa = 3.51SLKK179 pKa = 10.95DD180 pKa = 3.49GKK182 pKa = 10.36IDD184 pKa = 3.6AAFITSGAPTTAVTDD199 pKa = 4.14LGTAKK204 pKa = 10.32DD205 pKa = 3.94VYY207 pKa = 10.63LVSIDD212 pKa = 4.02DD213 pKa = 3.79EE214 pKa = 4.54HH215 pKa = 6.67MKK217 pKa = 9.76TLLEE221 pKa = 4.07EE222 pKa = 4.25CPYY225 pKa = 9.28YY226 pKa = 10.66TEE228 pKa = 4.27NTISADD234 pKa = 3.49TYY236 pKa = 11.74GLDD239 pKa = 3.58EE240 pKa = 4.69DD241 pKa = 4.6VKK243 pKa = 9.03TVAVGAVVIASNDD256 pKa = 3.35VAEE259 pKa = 4.43DD260 pKa = 4.29DD261 pKa = 3.9IYY263 pKa = 11.75NFVSAVFEE271 pKa = 4.08NTDD274 pKa = 3.85AIEE277 pKa = 4.01TAHH280 pKa = 6.97AKK282 pKa = 9.97GAEE285 pKa = 3.98LDD287 pKa = 3.53LDD289 pKa = 3.98YY290 pKa = 11.03AASITSVPYY299 pKa = 9.78HH300 pKa = 6.72AGAAKK305 pKa = 10.09YY306 pKa = 10.15FEE308 pKa = 4.68EE309 pKa = 5.18KK310 pKa = 10.72GLTVEE315 pKa = 4.72TEE317 pKa = 3.79
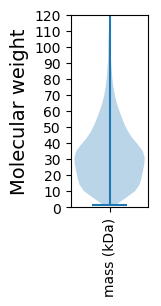
Molecular weight: 33.07 kDa
Isoelectric point according different methods:
Protein with the highest isoelectric point:
>tr|A0A373A7N1|A0A373A7N1_9FIRM YbaK/EbsC family protein OS=Lachnospiraceae bacterium OF09-6 OX=2293831 GN=DXA98_12505 PE=4 SV=1
MM1 pKa = 7.7AKK3 pKa = 8.05MTFQPKK9 pKa = 9.15KK10 pKa = 7.58RR11 pKa = 11.84QRR13 pKa = 11.84SKK15 pKa = 9.0VHH17 pKa = 5.93GFRR20 pKa = 11.84SRR22 pKa = 11.84MSTPGGRR29 pKa = 11.84KK30 pKa = 8.8VLAARR35 pKa = 11.84RR36 pKa = 11.84AKK38 pKa = 9.71GRR40 pKa = 11.84KK41 pKa = 8.73VLSAA45 pKa = 4.05
MM1 pKa = 7.7AKK3 pKa = 8.05MTFQPKK9 pKa = 9.15KK10 pKa = 7.58RR11 pKa = 11.84QRR13 pKa = 11.84SKK15 pKa = 9.0VHH17 pKa = 5.93GFRR20 pKa = 11.84SRR22 pKa = 11.84MSTPGGRR29 pKa = 11.84KK30 pKa = 8.8VLAARR35 pKa = 11.84RR36 pKa = 11.84AKK38 pKa = 9.71GRR40 pKa = 11.84KK41 pKa = 8.73VLSAA45 pKa = 4.05
Molecular weight: 5.1 kDa
Isoelectric point according different methods:
Peptides (in silico digests for buttom-up proteomics)
Below you can find in silico digests of the whole proteome with Trypsin, Chymotrypsin, Trypsin+LysC, LysN, ArgC proteases suitable for different mass spec machines.| Try ESI |
 |
|---|
| ChTry ESI |
 |
|---|
| ArgC ESI |
 |
|---|
| LysN ESI |
 |
|---|
| TryLysC ESI |
 |
|---|
| Try MALDI |
 |
|---|
| ChTry MALDI |
 |
|---|
| ArgC MALDI |
 |
|---|
| LysN MALDI |
 |
|---|
| TryLysC MALDI |
 |
|---|
| Try LTQ |
 |
|---|
| ChTry LTQ |
 |
|---|
| ArgC LTQ |
 |
|---|
| LysN LTQ |
 |
|---|
| TryLysC LTQ |
 |
|---|
| Try MSlow |
 |
|---|
| ChTry MSlow |
 |
|---|
| ArgC MSlow |
 |
|---|
| LysN MSlow |
 |
|---|
| TryLysC MSlow |
 |
|---|
| Try MShigh |
 |
|---|
| ChTry MShigh |
 |
|---|
| ArgC MShigh |
 |
|---|
| LysN MShigh |
 |
|---|
| TryLysC MShigh |
 |
|---|
General Statistics
Number of major isoforms |
Number of additional isoforms |
Number of all proteins |
Number of amino acids |
Min. Seq. Length |
Max. Seq. Length |
Avg. Seq. Length |
Avg. Mol. Weight |
|---|---|---|---|---|---|---|---|
0 |
872464 |
14 |
3784 |
305.4 |
34.31 |
Amino acid frequency
Ala |
Cys |
Asp |
Glu |
Phe |
Gly |
His |
Ile |
Lys |
Leu |
|---|---|---|---|---|---|---|---|---|---|
7.417 ± 0.049 | 1.576 ± 0.022 |
5.558 ± 0.045 | 7.82 ± 0.052 |
3.863 ± 0.037 | 7.019 ± 0.044 |
1.824 ± 0.022 | 7.294 ± 0.043 |
6.748 ± 0.047 | 8.874 ± 0.062 |
Met |
Asn |
Gln |
Pro |
Arg |
Ser |
Thr |
Val |
Trp |
Tyr |
|---|---|---|---|---|---|---|---|---|---|
3.325 ± 0.028 | 4.186 ± 0.029 |
3.162 ± 0.023 | 3.668 ± 0.029 |
4.303 ± 0.039 | 5.726 ± 0.037 |
5.642 ± 0.057 | 6.806 ± 0.032 |
0.978 ± 0.015 | 4.212 ± 0.031 |
Most of the basic statistics you can see at this page can be downloaded from this CSV file
Proteome-pI is available under Creative Commons Attribution-NoDerivs license, for more details see here
| Reference: Kozlowski LP. Proteome-pI 2.0: Proteome Isoelectric Point Database Update. Nucleic Acids Res. 2021, doi: 10.1093/nar/gkab944 | Contact: Lukasz P. Kozlowski |
