Streptomyces sp. SID7982
Taxonomy: cellular organisms; Bacteria; Terrabacteria group; Actinobacteria; Actinomycetia; Streptomycetales; Streptomycetaceae; Streptomyces; unclassified Streptomyces
Average proteome isoelectric point is 6.29
Get precalculated fractions of proteins

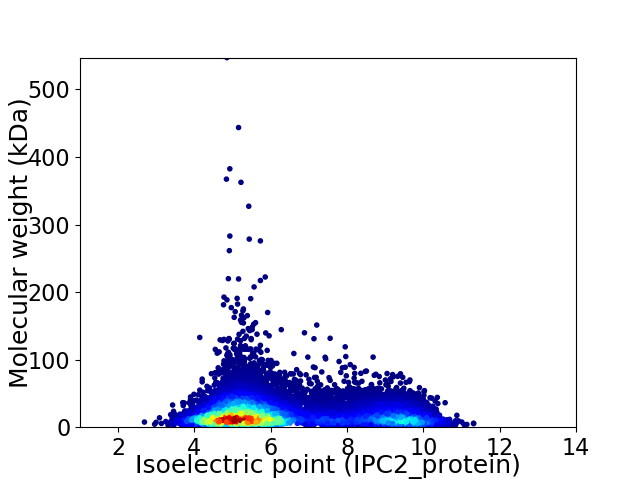
Virtual 2D-PAGE plot for 19102 proteins (isoelectric point calculated using IPC2_protein)
Get csv file with sequences according to given criteria:
* You can choose from 21 different methods for calculating isoelectric point
Summary statistics related to proteome-wise predictions


Protein with the lowest isoelectric point:
>tr|A0A6B3GEV9|A0A6B3GEV9_9ACTN Peroxiredoxin (Fragment) OS=Streptomyces sp. SID7982 OX=2706094 GN=G3M53_48590 PE=4 SV=1
AA1 pKa = 7.8AEE3 pKa = 4.27AAPAPVAAPAAVPAHH18 pKa = 6.46AVTGYY23 pKa = 8.39WQNFNNGATVQTLADD38 pKa = 3.69VPDD41 pKa = 4.69AYY43 pKa = 10.84DD44 pKa = 4.0IIAVSFADD52 pKa = 3.56ATAEE56 pKa = 4.0PGEE59 pKa = 4.22ITFTLDD65 pKa = 2.87SAGLGGYY72 pKa = 7.74TDD74 pKa = 3.51EE75 pKa = 5.29QFRR78 pKa = 11.84ADD80 pKa = 4.05LAAKK84 pKa = 9.65QADD87 pKa = 4.03GKK89 pKa = 10.69SVIISVGGEE98 pKa = 3.7KK99 pKa = 10.64GAVAVNDD106 pKa = 3.77SASAQRR112 pKa = 11.84FADD115 pKa = 3.25STYY118 pKa = 11.42ALMRR122 pKa = 11.84EE123 pKa = 4.13YY124 pKa = 11.03GFDD127 pKa = 3.53GVDD130 pKa = 2.97IDD132 pKa = 6.01LEE134 pKa = 4.43NGLNSTYY141 pKa = 8.08MTEE144 pKa = 4.38ALTKK148 pKa = 9.78LHH150 pKa = 6.64EE151 pKa = 4.43KK152 pKa = 10.76AGDD155 pKa = 3.85GLVLTMAPQTIDD167 pKa = 3.19MQSPEE172 pKa = 3.83NEE174 pKa = 4.08YY175 pKa = 10.8FKK177 pKa = 10.61TALAVKK183 pKa = 10.53DD184 pKa = 3.81FLTVVNMQYY193 pKa = 11.07YY194 pKa = 10.53NSGSMLGCDD203 pKa = 3.33GQVYY207 pKa = 10.18SQGTVDD213 pKa = 5.79FLTALACIQLEE224 pKa = 4.2NGLDD228 pKa = 3.52ASQVGIGVPASPKK241 pKa = 9.95AAGGGYY247 pKa = 9.27VEE249 pKa = 4.59PSVVNDD255 pKa = 4.47ALDD258 pKa = 3.85CLTRR262 pKa = 11.84GTDD265 pKa = 3.36CGSFTPEE272 pKa = 3.24KK273 pKa = 9.66TYY275 pKa = 10.25PALRR279 pKa = 11.84GAMTWSTNWDD289 pKa = 3.68ADD291 pKa = 4.35NGNAWSNAVGPHH303 pKa = 6.36VDD305 pKa = 4.25DD306 pKa = 5.51LPP308 pKa = 5.91
AA1 pKa = 7.8AEE3 pKa = 4.27AAPAPVAAPAAVPAHH18 pKa = 6.46AVTGYY23 pKa = 8.39WQNFNNGATVQTLADD38 pKa = 3.69VPDD41 pKa = 4.69AYY43 pKa = 10.84DD44 pKa = 4.0IIAVSFADD52 pKa = 3.56ATAEE56 pKa = 4.0PGEE59 pKa = 4.22ITFTLDD65 pKa = 2.87SAGLGGYY72 pKa = 7.74TDD74 pKa = 3.51EE75 pKa = 5.29QFRR78 pKa = 11.84ADD80 pKa = 4.05LAAKK84 pKa = 9.65QADD87 pKa = 4.03GKK89 pKa = 10.69SVIISVGGEE98 pKa = 3.7KK99 pKa = 10.64GAVAVNDD106 pKa = 3.77SASAQRR112 pKa = 11.84FADD115 pKa = 3.25STYY118 pKa = 11.42ALMRR122 pKa = 11.84EE123 pKa = 4.13YY124 pKa = 11.03GFDD127 pKa = 3.53GVDD130 pKa = 2.97IDD132 pKa = 6.01LEE134 pKa = 4.43NGLNSTYY141 pKa = 8.08MTEE144 pKa = 4.38ALTKK148 pKa = 9.78LHH150 pKa = 6.64EE151 pKa = 4.43KK152 pKa = 10.76AGDD155 pKa = 3.85GLVLTMAPQTIDD167 pKa = 3.19MQSPEE172 pKa = 3.83NEE174 pKa = 4.08YY175 pKa = 10.8FKK177 pKa = 10.61TALAVKK183 pKa = 10.53DD184 pKa = 3.81FLTVVNMQYY193 pKa = 11.07YY194 pKa = 10.53NSGSMLGCDD203 pKa = 3.33GQVYY207 pKa = 10.18SQGTVDD213 pKa = 5.79FLTALACIQLEE224 pKa = 4.2NGLDD228 pKa = 3.52ASQVGIGVPASPKK241 pKa = 9.95AAGGGYY247 pKa = 9.27VEE249 pKa = 4.59PSVVNDD255 pKa = 4.47ALDD258 pKa = 3.85CLTRR262 pKa = 11.84GTDD265 pKa = 3.36CGSFTPEE272 pKa = 3.24KK273 pKa = 9.66TYY275 pKa = 10.25PALRR279 pKa = 11.84GAMTWSTNWDD289 pKa = 3.68ADD291 pKa = 4.35NGNAWSNAVGPHH303 pKa = 6.36VDD305 pKa = 4.25DD306 pKa = 5.51LPP308 pKa = 5.91
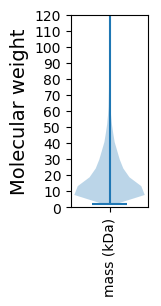
Molecular weight: 32.14 kDa
Isoelectric point according different methods:
Protein with the highest isoelectric point:
>tr|A0A6B3GR04|A0A6B3GR04_9ACTN Bifunctional 4-hydroxy-2-oxoglutarate aldolase/2-dehydro-3-deoxy-phosphogluconate aldolase OS=Streptomyces sp. SID7982 OX=2706094 GN=G3M53_85820 PE=3 SV=1
MM1 pKa = 7.69SKK3 pKa = 9.0RR4 pKa = 11.84TFQPNNRR11 pKa = 11.84RR12 pKa = 11.84RR13 pKa = 11.84AKK15 pKa = 8.7THH17 pKa = 5.15GFRR20 pKa = 11.84LRR22 pKa = 11.84MRR24 pKa = 11.84TRR26 pKa = 11.84AGRR29 pKa = 11.84AILASRR35 pKa = 11.84RR36 pKa = 11.84GKK38 pKa = 10.36GRR40 pKa = 11.84ARR42 pKa = 11.84LSAA45 pKa = 3.91
MM1 pKa = 7.69SKK3 pKa = 9.0RR4 pKa = 11.84TFQPNNRR11 pKa = 11.84RR12 pKa = 11.84RR13 pKa = 11.84AKK15 pKa = 8.7THH17 pKa = 5.15GFRR20 pKa = 11.84LRR22 pKa = 11.84MRR24 pKa = 11.84TRR26 pKa = 11.84AGRR29 pKa = 11.84AILASRR35 pKa = 11.84RR36 pKa = 11.84GKK38 pKa = 10.36GRR40 pKa = 11.84ARR42 pKa = 11.84LSAA45 pKa = 3.91
Molecular weight: 5.25 kDa
Isoelectric point according different methods:
Peptides (in silico digests for buttom-up proteomics)
Below you can find in silico digests of the whole proteome with Trypsin, Chymotrypsin, Trypsin+LysC, LysN, ArgC proteases suitable for different mass spec machines.| Try ESI |
 |
|---|
| ChTry ESI |
 |
|---|
| ArgC ESI |
 |
|---|
| LysN ESI |
 |
|---|
| TryLysC ESI |
 |
|---|
| Try MALDI |
 |
|---|
| ChTry MALDI |
 |
|---|
| ArgC MALDI |
 |
|---|
| LysN MALDI |
 |
|---|
| TryLysC MALDI |
 |
|---|
| Try LTQ |
 |
|---|
| ChTry LTQ |
 |
|---|
| ArgC LTQ |
 |
|---|
| LysN LTQ |
 |
|---|
| TryLysC LTQ |
 |
|---|
| Try MSlow |
 |
|---|
| ChTry MSlow |
 |
|---|
| ArgC MSlow |
 |
|---|
| LysN MSlow |
 |
|---|
| TryLysC MSlow |
 |
|---|
| Try MShigh |
 |
|---|
| ChTry MShigh |
 |
|---|
| ArgC MShigh |
 |
|---|
| LysN MShigh |
 |
|---|
| TryLysC MShigh |
 |
|---|
General Statistics
Number of major isoforms |
Number of additional isoforms |
Number of all proteins |
Number of amino acids |
Min. Seq. Length |
Max. Seq. Length |
Avg. Seq. Length |
Avg. Mol. Weight |
|---|---|---|---|---|---|---|---|
0 |
3686652 |
20 |
5266 |
193.0 |
20.67 |
Amino acid frequency
Ala |
Cys |
Asp |
Glu |
Phe |
Gly |
His |
Ile |
Lys |
Leu |
|---|---|---|---|---|---|---|---|---|---|
13.597 ± 0.027 | 0.76 ± 0.006 |
6.026 ± 0.018 | 5.998 ± 0.02 |
2.749 ± 0.013 | 9.557 ± 0.019 |
2.289 ± 0.011 | 3.077 ± 0.015 |
2.159 ± 0.017 | 10.484 ± 0.026 |
Met |
Asn |
Gln |
Pro |
Arg |
Ser |
Thr |
Val |
Trp |
Tyr |
|---|---|---|---|---|---|---|---|---|---|
1.707 ± 0.009 | 1.699 ± 0.01 |
6.096 ± 0.017 | 2.694 ± 0.012 |
8.027 ± 0.021 | 4.976 ± 0.016 |
6.115 ± 0.016 | 8.445 ± 0.02 |
1.5 ± 0.01 | 2.043 ± 0.011 |
Most of the basic statistics you can see at this page can be downloaded from this CSV file
Proteome-pI is available under Creative Commons Attribution-NoDerivs license, for more details see here
| Reference: Kozlowski LP. Proteome-pI 2.0: Proteome Isoelectric Point Database Update. Nucleic Acids Res. 2021, doi: 10.1093/nar/gkab944 | Contact: Lukasz P. Kozlowski |
