Sporomusaceae bacterium
Taxonomy: cellular organisms; Bacteria; Terrabacteria group; Firmicutes; Negativicutes; Selenomonadales; Sporomusaceae; unclassified Sporomusaceae
Average proteome isoelectric point is 6.46
Get precalculated fractions of proteins

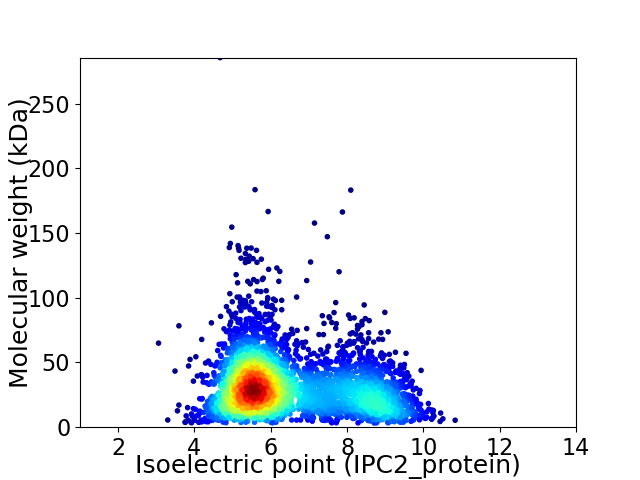
Virtual 2D-PAGE plot for 3820 proteins (isoelectric point calculated using IPC2_protein)
Get csv file with sequences according to given criteria:
* You can choose from 21 different methods for calculating isoelectric point
Summary statistics related to proteome-wise predictions


Protein with the lowest isoelectric point:
>tr|A0A402BVE1|A0A402BVE1_9FIRM Uncharacterized protein OS=Sporomusaceae bacterium OX=1917525 GN=SPFL3102_03204 PE=4 SV=1
MM1 pKa = 7.06MMSMYY6 pKa = 10.57SGVSGLKK13 pKa = 10.01AQQTKK18 pKa = 11.07LNVIGNNIANVSTTGYY34 pKa = 10.46KK35 pKa = 9.45YY36 pKa = 9.09QTVSFSDD43 pKa = 4.09LLSQTLSGATAANTATNQGGTNAKK67 pKa = 10.18QIGLGVGVSATTTVMTTGSTQSTGNSSDD95 pKa = 3.41VSISGDD101 pKa = 3.08GFFIVKK107 pKa = 9.96GGSSGEE113 pKa = 4.1YY114 pKa = 9.53QFTRR118 pKa = 11.84AGNFGVDD125 pKa = 3.12ANGNLTVGGLTVCGWQDD142 pKa = 3.26YY143 pKa = 10.72GGAAQADD150 pKa = 3.85GTYY153 pKa = 9.96TYY155 pKa = 8.22DD156 pKa = 3.26TQKK159 pKa = 9.63TVEE162 pKa = 4.73PINLFSDD169 pKa = 4.14SYY171 pKa = 11.47NGNKK175 pKa = 9.73QIIAPEE181 pKa = 3.94ATTAATLTGNLTSSATASGTALNDD205 pKa = 2.86IGTGFSFDD213 pKa = 3.49TTDD216 pKa = 3.38ADD218 pKa = 5.02AITTMTVYY226 pKa = 10.57DD227 pKa = 4.09AQGNSYY233 pKa = 10.67DD234 pKa = 3.57VQVNFKK240 pKa = 9.91KK241 pKa = 10.71CYY243 pKa = 10.41VDD245 pKa = 3.45TTDD248 pKa = 4.17ADD250 pKa = 3.87NPVTSWYY257 pKa = 9.51WEE259 pKa = 3.97ADD261 pKa = 3.46SSDD264 pKa = 3.57TTLSNASGYY273 pKa = 8.34ITFDD277 pKa = 3.25STGKK281 pKa = 10.23IIPVTDD287 pKa = 3.25STADD291 pKa = 3.39YY292 pKa = 7.5TTSPKK297 pKa = 9.0ITIAGSDD304 pKa = 3.39SVTPFEE310 pKa = 5.2ISLDD314 pKa = 3.49LTGISTYY321 pKa = 10.12TSSSSNGVSVSQIDD335 pKa = 4.42GYY337 pKa = 11.39EE338 pKa = 4.02SGEE341 pKa = 4.08LQDD344 pKa = 4.0FTIGSDD350 pKa = 3.81GVITGVYY357 pKa = 10.44SNGQTQPLGMIALATFANAAGLEE380 pKa = 4.24KK381 pKa = 10.14IGNNLYY387 pKa = 8.78VTTANSGAFTGGVPAGSKK405 pKa = 9.29GTGSLSSGTLEE416 pKa = 3.98MSNVDD421 pKa = 3.58LAEE424 pKa = 4.09QFSEE428 pKa = 4.07MMITQRR434 pKa = 11.84AYY436 pKa = 9.88QANSKK441 pKa = 10.22IISTSDD447 pKa = 2.89EE448 pKa = 4.03MLQTLINMVKK458 pKa = 10.47
MM1 pKa = 7.06MMSMYY6 pKa = 10.57SGVSGLKK13 pKa = 10.01AQQTKK18 pKa = 11.07LNVIGNNIANVSTTGYY34 pKa = 10.46KK35 pKa = 9.45YY36 pKa = 9.09QTVSFSDD43 pKa = 4.09LLSQTLSGATAANTATNQGGTNAKK67 pKa = 10.18QIGLGVGVSATTTVMTTGSTQSTGNSSDD95 pKa = 3.41VSISGDD101 pKa = 3.08GFFIVKK107 pKa = 9.96GGSSGEE113 pKa = 4.1YY114 pKa = 9.53QFTRR118 pKa = 11.84AGNFGVDD125 pKa = 3.12ANGNLTVGGLTVCGWQDD142 pKa = 3.26YY143 pKa = 10.72GGAAQADD150 pKa = 3.85GTYY153 pKa = 9.96TYY155 pKa = 8.22DD156 pKa = 3.26TQKK159 pKa = 9.63TVEE162 pKa = 4.73PINLFSDD169 pKa = 4.14SYY171 pKa = 11.47NGNKK175 pKa = 9.73QIIAPEE181 pKa = 3.94ATTAATLTGNLTSSATASGTALNDD205 pKa = 2.86IGTGFSFDD213 pKa = 3.49TTDD216 pKa = 3.38ADD218 pKa = 5.02AITTMTVYY226 pKa = 10.57DD227 pKa = 4.09AQGNSYY233 pKa = 10.67DD234 pKa = 3.57VQVNFKK240 pKa = 9.91KK241 pKa = 10.71CYY243 pKa = 10.41VDD245 pKa = 3.45TTDD248 pKa = 4.17ADD250 pKa = 3.87NPVTSWYY257 pKa = 9.51WEE259 pKa = 3.97ADD261 pKa = 3.46SSDD264 pKa = 3.57TTLSNASGYY273 pKa = 8.34ITFDD277 pKa = 3.25STGKK281 pKa = 10.23IIPVTDD287 pKa = 3.25STADD291 pKa = 3.39YY292 pKa = 7.5TTSPKK297 pKa = 9.0ITIAGSDD304 pKa = 3.39SVTPFEE310 pKa = 5.2ISLDD314 pKa = 3.49LTGISTYY321 pKa = 10.12TSSSSNGVSVSQIDD335 pKa = 4.42GYY337 pKa = 11.39EE338 pKa = 4.02SGEE341 pKa = 4.08LQDD344 pKa = 4.0FTIGSDD350 pKa = 3.81GVITGVYY357 pKa = 10.44SNGQTQPLGMIALATFANAAGLEE380 pKa = 4.24KK381 pKa = 10.14IGNNLYY387 pKa = 8.78VTTANSGAFTGGVPAGSKK405 pKa = 9.29GTGSLSSGTLEE416 pKa = 3.98MSNVDD421 pKa = 3.58LAEE424 pKa = 4.09QFSEE428 pKa = 4.07MMITQRR434 pKa = 11.84AYY436 pKa = 9.88QANSKK441 pKa = 10.22IISTSDD447 pKa = 2.89EE448 pKa = 4.03MLQTLINMVKK458 pKa = 10.47
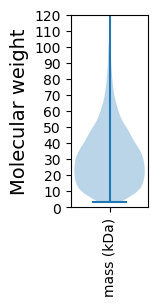
Molecular weight: 47.29 kDa
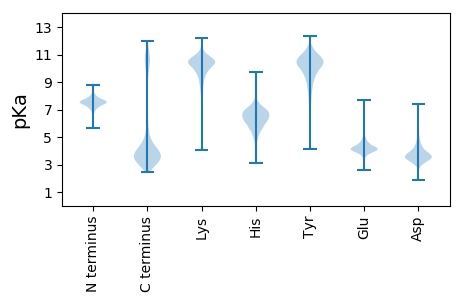
Isoelectric point according different methods:
Protein with the highest isoelectric point:
>tr|A0A402BRZ4|A0A402BRZ4_9FIRM Uncharacterized protein OS=Sporomusaceae bacterium OX=1917525 GN=SPFL3102_01922 PE=4 SV=1
MM1 pKa = 7.98CYY3 pKa = 10.39LNKK6 pKa = 9.99QSEE9 pKa = 4.45NLHH12 pKa = 5.98TNHH15 pKa = 5.94QSRR18 pKa = 11.84WIARR22 pKa = 11.84SITVFQQSRR31 pKa = 11.84SYY33 pKa = 9.14QVRR36 pKa = 11.84WLNLSAVRR44 pKa = 11.84TLTWWKK50 pKa = 10.45VAGLLILFGVAFIQLIKK67 pKa = 10.77VLNLDD72 pKa = 3.32HH73 pKa = 6.95HH74 pKa = 6.64AA75 pKa = 4.62
MM1 pKa = 7.98CYY3 pKa = 10.39LNKK6 pKa = 9.99QSEE9 pKa = 4.45NLHH12 pKa = 5.98TNHH15 pKa = 5.94QSRR18 pKa = 11.84WIARR22 pKa = 11.84SITVFQQSRR31 pKa = 11.84SYY33 pKa = 9.14QVRR36 pKa = 11.84WLNLSAVRR44 pKa = 11.84TLTWWKK50 pKa = 10.45VAGLLILFGVAFIQLIKK67 pKa = 10.77VLNLDD72 pKa = 3.32HH73 pKa = 6.95HH74 pKa = 6.64AA75 pKa = 4.62
Molecular weight: 8.86 kDa
Isoelectric point according different methods:
Peptides (in silico digests for buttom-up proteomics)
Below you can find in silico digests of the whole proteome with Trypsin, Chymotrypsin, Trypsin+LysC, LysN, ArgC proteases suitable for different mass spec machines.| Try ESI |
 |
|---|
| ChTry ESI |
 |
|---|
| ArgC ESI |
 |
|---|
| LysN ESI |
 |
|---|
| TryLysC ESI |
 |
|---|
| Try MALDI |
 |
|---|
| ChTry MALDI |
 |
|---|
| ArgC MALDI |
 |
|---|
| LysN MALDI |
 |
|---|
| TryLysC MALDI |
 |
|---|
| Try LTQ |
 |
|---|
| ChTry LTQ |
 |
|---|
| ArgC LTQ |
 |
|---|
| LysN LTQ |
 |
|---|
| TryLysC LTQ |
 |
|---|
| Try MSlow |
 |
|---|
| ChTry MSlow |
 |
|---|
| ArgC MSlow |
 |
|---|
| LysN MSlow |
 |
|---|
| TryLysC MSlow |
 |
|---|
| Try MShigh |
 |
|---|
| ChTry MShigh |
 |
|---|
| ArgC MShigh |
 |
|---|
| LysN MShigh |
 |
|---|
| TryLysC MShigh |
 |
|---|
General Statistics
Number of major isoforms |
Number of additional isoforms |
Number of all proteins |
Number of amino acids |
Min. Seq. Length |
Max. Seq. Length |
Avg. Seq. Length |
Avg. Mol. Weight |
|---|---|---|---|---|---|---|---|
1142366 |
29 |
2748 |
299.0 |
33.05 |
Amino acid frequency
Ala |
Cys |
Asp |
Glu |
Phe |
Gly |
His |
Ile |
Lys |
Leu |
|---|---|---|---|---|---|---|---|---|---|
8.94 ± 0.043 | 1.168 ± 0.019 |
4.913 ± 0.029 | 6.076 ± 0.041 |
3.882 ± 0.028 | 7.303 ± 0.039 |
2.003 ± 0.019 | 7.812 ± 0.037 |
5.74 ± 0.034 | 10.002 ± 0.043 |
Met |
Asn |
Gln |
Pro |
Arg |
Ser |
Thr |
Val |
Trp |
Tyr |
|---|---|---|---|---|---|---|---|---|---|
2.65 ± 0.02 | 4.181 ± 0.032 |
3.828 ± 0.025 | 4.13 ± 0.03 |
4.443 ± 0.027 | 5.849 ± 0.029 |
5.51 ± 0.042 | 7.357 ± 0.034 |
0.95 ± 0.015 | 3.264 ± 0.027 |
Most of the basic statistics you can see at this page can be downloaded from this CSV file
Proteome-pI is available under Creative Commons Attribution-NoDerivs license, for more details see here
| Reference: Kozlowski LP. Proteome-pI 2.0: Proteome Isoelectric Point Database Update. Nucleic Acids Res. 2021, doi: 10.1093/nar/gkab944 | Contact: Lukasz P. Kozlowski |
