Colwellia sp. PAMC 21821
Taxonomy: cellular organisms; Bacteria; Proteobacteria; Gammaproteobacteria; Alteromonadales; Colwelliaceae; Colwellia; unclassified Colwellia
Average proteome isoelectric point is 6.25
Get precalculated fractions of proteins

Virtual 2D-PAGE plot for 3841 proteins (isoelectric point calculated using IPC2_protein)
Get csv file with sequences according to given criteria:
* You can choose from 21 different methods for calculating isoelectric point
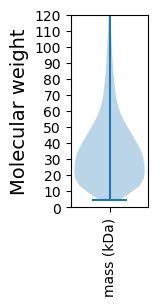
Summary statistics related to proteome-wise predictions


Protein with the lowest isoelectric point:
>tr|A0A1V0KSI6|A0A1V0KSI6_9GAMM PspC domain-containing protein OS=Colwellia sp. PAMC 21821 OX=1816219 GN=A3Q33_10585 PE=4 SV=1
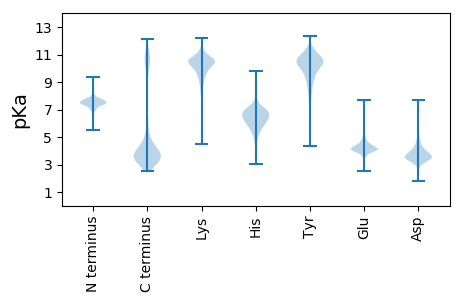
MM1 pKa = 7.48KK2 pKa = 10.25KK3 pKa = 9.56IALAVTLASILSTNVQADD21 pKa = 3.27ALGIYY26 pKa = 10.24LGGQIWDD33 pKa = 3.81NQASGTFGDD42 pKa = 4.94GSSQVDD48 pKa = 3.79FNLVDD53 pKa = 3.64EE54 pKa = 4.83KK55 pKa = 11.4QNSFFIAFEE64 pKa = 4.42HH65 pKa = 6.54PLPLIPNIRR74 pKa = 11.84IASTALEE81 pKa = 4.28TKK83 pKa = 10.4GNKK86 pKa = 7.89TLNTEE91 pKa = 4.4FEE93 pKa = 4.59FEE95 pKa = 4.72GEE97 pKa = 4.3TFSQGTNVNADD108 pKa = 3.67FNVSYY113 pKa = 11.38VDD115 pKa = 3.23YY116 pKa = 9.57TLYY119 pKa = 11.34YY120 pKa = 10.64EE121 pKa = 5.79LFDD124 pKa = 4.27NDD126 pKa = 4.73LVSFDD131 pKa = 3.69IGLTGRR137 pKa = 11.84DD138 pKa = 3.22FDD140 pKa = 5.19GDD142 pKa = 3.99VTVSASSGANSQSGSVSVTDD162 pKa = 3.83IVPMLYY168 pKa = 10.61ARR170 pKa = 11.84TNVGLPLTGFNLYY183 pKa = 10.53AQGNFLSIDD192 pKa = 3.26DD193 pKa = 4.06HH194 pKa = 5.88TLYY197 pKa = 10.61DD198 pKa = 3.82YY199 pKa = 11.18EE200 pKa = 4.58VGVSYY205 pKa = 10.76EE206 pKa = 4.62LIDD209 pKa = 4.14NLAIDD214 pKa = 3.71VNINVGYY221 pKa = 10.1RR222 pKa = 11.84AVKK225 pKa = 10.76LEE227 pKa = 4.46LDD229 pKa = 4.55DD230 pKa = 6.81LNDD233 pKa = 3.98LYY235 pKa = 11.43TNIEE239 pKa = 3.85FDD241 pKa = 4.09GVFLGTTIHH250 pKa = 6.76FF251 pKa = 4.43
MM1 pKa = 7.48KK2 pKa = 10.25KK3 pKa = 9.56IALAVTLASILSTNVQADD21 pKa = 3.27ALGIYY26 pKa = 10.24LGGQIWDD33 pKa = 3.81NQASGTFGDD42 pKa = 4.94GSSQVDD48 pKa = 3.79FNLVDD53 pKa = 3.64EE54 pKa = 4.83KK55 pKa = 11.4QNSFFIAFEE64 pKa = 4.42HH65 pKa = 6.54PLPLIPNIRR74 pKa = 11.84IASTALEE81 pKa = 4.28TKK83 pKa = 10.4GNKK86 pKa = 7.89TLNTEE91 pKa = 4.4FEE93 pKa = 4.59FEE95 pKa = 4.72GEE97 pKa = 4.3TFSQGTNVNADD108 pKa = 3.67FNVSYY113 pKa = 11.38VDD115 pKa = 3.23YY116 pKa = 9.57TLYY119 pKa = 11.34YY120 pKa = 10.64EE121 pKa = 5.79LFDD124 pKa = 4.27NDD126 pKa = 4.73LVSFDD131 pKa = 3.69IGLTGRR137 pKa = 11.84DD138 pKa = 3.22FDD140 pKa = 5.19GDD142 pKa = 3.99VTVSASSGANSQSGSVSVTDD162 pKa = 3.83IVPMLYY168 pKa = 10.61ARR170 pKa = 11.84TNVGLPLTGFNLYY183 pKa = 10.53AQGNFLSIDD192 pKa = 3.26DD193 pKa = 4.06HH194 pKa = 5.88TLYY197 pKa = 10.61DD198 pKa = 3.82YY199 pKa = 11.18EE200 pKa = 4.58VGVSYY205 pKa = 10.76EE206 pKa = 4.62LIDD209 pKa = 4.14NLAIDD214 pKa = 3.71VNINVGYY221 pKa = 10.1RR222 pKa = 11.84AVKK225 pKa = 10.76LEE227 pKa = 4.46LDD229 pKa = 4.55DD230 pKa = 6.81LNDD233 pKa = 3.98LYY235 pKa = 11.43TNIEE239 pKa = 3.85FDD241 pKa = 4.09GVFLGTTIHH250 pKa = 6.76FF251 pKa = 4.43
Molecular weight: 27.48 kDa
Isoelectric point according different methods:
Protein with the highest isoelectric point:
>tr|A0A1V0KRE6|A0A1V0KRE6_9GAMM Ribonuclease P protein component OS=Colwellia sp. PAMC 21821 OX=1816219 GN=rnpA PE=3 SV=1
MM1 pKa = 7.45KK2 pKa = 9.51RR3 pKa = 11.84TFQPSVLKK11 pKa = 10.46RR12 pKa = 11.84KK13 pKa = 9.37RR14 pKa = 11.84NHH16 pKa = 5.37GFRR19 pKa = 11.84ARR21 pKa = 11.84MATKK25 pKa = 10.21NGRR28 pKa = 11.84AVISRR33 pKa = 11.84RR34 pKa = 11.84RR35 pKa = 11.84AKK37 pKa = 10.5GRR39 pKa = 11.84ASLSAA44 pKa = 3.83
MM1 pKa = 7.45KK2 pKa = 9.51RR3 pKa = 11.84TFQPSVLKK11 pKa = 10.46RR12 pKa = 11.84KK13 pKa = 9.37RR14 pKa = 11.84NHH16 pKa = 5.37GFRR19 pKa = 11.84ARR21 pKa = 11.84MATKK25 pKa = 10.21NGRR28 pKa = 11.84AVISRR33 pKa = 11.84RR34 pKa = 11.84RR35 pKa = 11.84AKK37 pKa = 10.5GRR39 pKa = 11.84ASLSAA44 pKa = 3.83
Molecular weight: 5.05 kDa
Isoelectric point according different methods:
Peptides (in silico digests for buttom-up proteomics)
Below you can find in silico digests of the whole proteome with Trypsin, Chymotrypsin, Trypsin+LysC, LysN, ArgC proteases suitable for different mass spec machines.| Try ESI |
 |
|---|
| ChTry ESI |
 |
|---|
| ArgC ESI |
 |
|---|
| LysN ESI |
 |
|---|
| TryLysC ESI |
 |
|---|
| Try MALDI |
 |
|---|
| ChTry MALDI |
 |
|---|
| ArgC MALDI |
 |
|---|
| LysN MALDI |
 |
|---|
| TryLysC MALDI |
 |
|---|
| Try LTQ |
 |
|---|
| ChTry LTQ |
 |
|---|
| ArgC LTQ |
 |
|---|
| LysN LTQ |
 |
|---|
| TryLysC LTQ |
 |
|---|
| Try MSlow |
 |
|---|
| ChTry MSlow |
 |
|---|
| ArgC MSlow |
 |
|---|
| LysN MSlow |
 |
|---|
| TryLysC MSlow |
 |
|---|
| Try MShigh |
 |
|---|
| ChTry MShigh |
 |
|---|
| ArgC MShigh |
 |
|---|
| LysN MShigh |
 |
|---|
| TryLysC MShigh |
 |
|---|
General Statistics
Number of major isoforms |
Number of additional isoforms |
Number of all proteins |
Number of amino acids |
Min. Seq. Length |
Max. Seq. Length |
Avg. Seq. Length |
Avg. Mol. Weight |
|---|---|---|---|---|---|---|---|
0 |
1307913 |
37 |
4402 |
340.5 |
37.8 |
Amino acid frequency
Ala |
Cys |
Asp |
Glu |
Phe |
Gly |
His |
Ile |
Lys |
Leu |
|---|---|---|---|---|---|---|---|---|---|
8.559 ± 0.044 | 0.981 ± 0.014 |
5.625 ± 0.048 | 5.879 ± 0.035 |
4.357 ± 0.027 | 6.47 ± 0.036 |
2.141 ± 0.02 | 7.152 ± 0.037 |
5.861 ± 0.04 | 10.128 ± 0.049 |
Met |
Asn |
Gln |
Pro |
Arg |
Ser |
Thr |
Val |
Trp |
Tyr |
|---|---|---|---|---|---|---|---|---|---|
2.389 ± 0.023 | 5.123 ± 0.041 |
3.617 ± 0.021 | 4.451 ± 0.031 |
3.877 ± 0.032 | 6.91 ± 0.042 |
5.601 ± 0.04 | 6.63 ± 0.033 |
1.144 ± 0.015 | 3.106 ± 0.023 |
Most of the basic statistics you can see at this page can be downloaded from this CSV file
Proteome-pI is available under Creative Commons Attribution-NoDerivs license, for more details see here
| Reference: Kozlowski LP. Proteome-pI 2.0: Proteome Isoelectric Point Database Update. Nucleic Acids Res. 2021, doi: 10.1093/nar/gkab944 | Contact: Lukasz P. Kozlowski |
