Klebsiella phage ST15-OXA48phi14.1
Taxonomy: Viruses; Duplodnaviria; Heunggongvirae; Uroviricota; Caudoviricetes; Caudovirales; Myoviridae; Peduovirinae; Felsduovirus; Klebsiella virus ST15OXA48phi14-1
Average proteome isoelectric point is 6.64
Get precalculated fractions of proteins

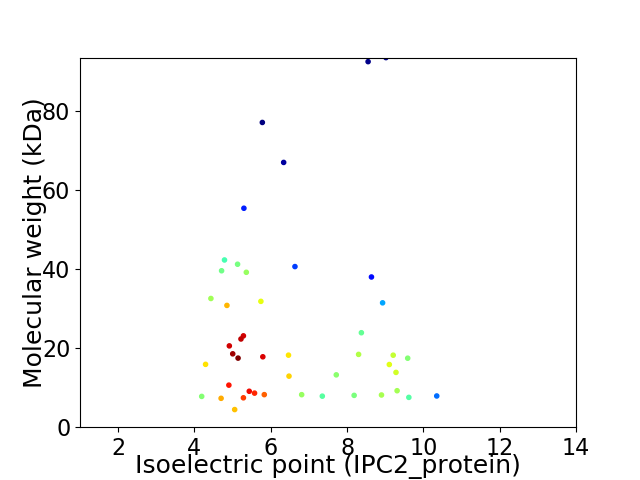
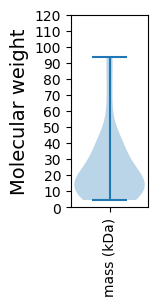
Virtual 2D-PAGE plot for 46 proteins (isoelectric point calculated using IPC2_protein)
Get csv file with sequences according to given criteria:
* You can choose from 21 different methods for calculating isoelectric point
Summary statistics related to proteome-wise predictions


Protein with the lowest isoelectric point:
>tr|A0A482MFR2|A0A482MFR2_9CAUD SsrA-binding protein OS=Klebsiella phage ST15-OXA48phi14.1 OX=2510455 PE=3 SV=1
MM1 pKa = 7.61AKK3 pKa = 9.95VDD5 pKa = 4.1LEE7 pKa = 4.23KK8 pKa = 10.4IIPVFALRR16 pKa = 11.84IANVGDD22 pKa = 3.78VTDD25 pKa = 4.72GQCTLTIEE33 pKa = 4.78GGQDD37 pKa = 2.98VSDD40 pKa = 3.61PVVVTEE46 pKa = 5.77EE47 pKa = 4.43YY48 pKa = 8.82IQKK51 pKa = 10.31YY52 pKa = 8.83NPQPGGYY59 pKa = 10.37YY60 pKa = 9.94IMCSNGVGLYY70 pKa = 10.88SNN72 pKa = 4.73
MM1 pKa = 7.61AKK3 pKa = 9.95VDD5 pKa = 4.1LEE7 pKa = 4.23KK8 pKa = 10.4IIPVFALRR16 pKa = 11.84IANVGDD22 pKa = 3.78VTDD25 pKa = 4.72GQCTLTIEE33 pKa = 4.78GGQDD37 pKa = 2.98VSDD40 pKa = 3.61PVVVTEE46 pKa = 5.77EE47 pKa = 4.43YY48 pKa = 8.82IQKK51 pKa = 10.31YY52 pKa = 8.83NPQPGGYY59 pKa = 10.37YY60 pKa = 9.94IMCSNGVGLYY70 pKa = 10.88SNN72 pKa = 4.73
Molecular weight: 7.8 kDa
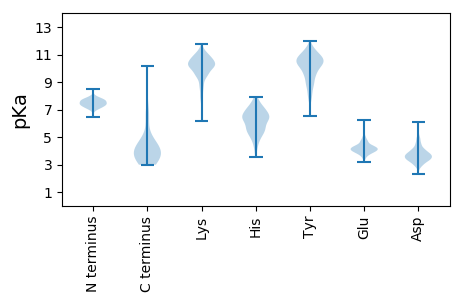
Isoelectric point according different methods:
Protein with the highest isoelectric point:
>tr|A0A482MGE7|A0A482MGE7_9CAUD Tail assembly protein OS=Klebsiella phage ST15-OXA48phi14.1 OX=2510455 PE=4 SV=1
MM1 pKa = 7.95AEE3 pKa = 4.03LQEE6 pKa = 3.86VDD8 pKa = 3.08AWLDD12 pKa = 3.31ALLAEE17 pKa = 5.05LEE19 pKa = 4.01PAEE22 pKa = 4.91RR23 pKa = 11.84KK24 pKa = 10.21RR25 pKa = 11.84MMRR28 pKa = 11.84DD29 pKa = 2.87LAQQLRR35 pKa = 11.84RR36 pKa = 11.84SQQKK40 pKa = 9.63NIRR43 pKa = 11.84MQRR46 pKa = 11.84NPDD49 pKa = 2.92GTAYY53 pKa = 10.1EE54 pKa = 4.13PRR56 pKa = 11.84RR57 pKa = 11.84VTARR61 pKa = 11.84AKK63 pKa = 9.44QGRR66 pKa = 11.84IRR68 pKa = 11.84RR69 pKa = 11.84QMFAKK74 pKa = 10.41LRR76 pKa = 11.84TTKK79 pKa = 10.36YY80 pKa = 9.29LKK82 pKa = 10.56AVASQDD88 pKa = 3.55SASVEE93 pKa = 4.1FEE95 pKa = 4.01SRR97 pKa = 11.84VQRR100 pKa = 11.84IARR103 pKa = 11.84VHH105 pKa = 6.27HH106 pKa = 5.92YY107 pKa = 10.35GLRR110 pKa = 11.84DD111 pKa = 3.15RR112 pKa = 11.84VSRR115 pKa = 11.84KK116 pKa = 9.95GPEE119 pKa = 3.44VKK121 pKa = 10.34YY122 pKa = 10.89AEE124 pKa = 4.16RR125 pKa = 11.84RR126 pKa = 11.84LLGINDD132 pKa = 3.61EE133 pKa = 4.71SEE135 pKa = 5.02DD136 pKa = 3.32ITRR139 pKa = 11.84DD140 pKa = 3.27VLLRR144 pKa = 11.84WLSQQ148 pKa = 2.99
MM1 pKa = 7.95AEE3 pKa = 4.03LQEE6 pKa = 3.86VDD8 pKa = 3.08AWLDD12 pKa = 3.31ALLAEE17 pKa = 5.05LEE19 pKa = 4.01PAEE22 pKa = 4.91RR23 pKa = 11.84KK24 pKa = 10.21RR25 pKa = 11.84MMRR28 pKa = 11.84DD29 pKa = 2.87LAQQLRR35 pKa = 11.84RR36 pKa = 11.84SQQKK40 pKa = 9.63NIRR43 pKa = 11.84MQRR46 pKa = 11.84NPDD49 pKa = 2.92GTAYY53 pKa = 10.1EE54 pKa = 4.13PRR56 pKa = 11.84RR57 pKa = 11.84VTARR61 pKa = 11.84AKK63 pKa = 9.44QGRR66 pKa = 11.84IRR68 pKa = 11.84RR69 pKa = 11.84QMFAKK74 pKa = 10.41LRR76 pKa = 11.84TTKK79 pKa = 10.36YY80 pKa = 9.29LKK82 pKa = 10.56AVASQDD88 pKa = 3.55SASVEE93 pKa = 4.1FEE95 pKa = 4.01SRR97 pKa = 11.84VQRR100 pKa = 11.84IARR103 pKa = 11.84VHH105 pKa = 6.27HH106 pKa = 5.92YY107 pKa = 10.35GLRR110 pKa = 11.84DD111 pKa = 3.15RR112 pKa = 11.84VSRR115 pKa = 11.84KK116 pKa = 9.95GPEE119 pKa = 3.44VKK121 pKa = 10.34YY122 pKa = 10.89AEE124 pKa = 4.16RR125 pKa = 11.84RR126 pKa = 11.84LLGINDD132 pKa = 3.61EE133 pKa = 4.71SEE135 pKa = 5.02DD136 pKa = 3.32ITRR139 pKa = 11.84DD140 pKa = 3.27VLLRR144 pKa = 11.84WLSQQ148 pKa = 2.99
Molecular weight: 17.48 kDa
Isoelectric point according different methods:
Peptides (in silico digests for buttom-up proteomics)
Below you can find in silico digests of the whole proteome with Trypsin, Chymotrypsin, Trypsin+LysC, LysN, ArgC proteases suitable for different mass spec machines.| Try ESI |
 |
|---|
| ChTry ESI |
 |
|---|
| ArgC ESI |
 |
|---|
| LysN ESI |
 |
|---|
| TryLysC ESI |
 |
|---|
| Try MALDI |
 |
|---|
| ChTry MALDI |
 |
|---|
| ArgC MALDI |
 |
|---|
| LysN MALDI |
 |
|---|
| TryLysC MALDI |
 |
|---|
| Try LTQ |
 |
|---|
| ChTry LTQ |
 |
|---|
| ArgC LTQ |
 |
|---|
| LysN LTQ |
 |
|---|
| TryLysC LTQ |
 |
|---|
| Try MSlow |
 |
|---|
| ChTry MSlow |
 |
|---|
| ArgC MSlow |
 |
|---|
| LysN MSlow |
 |
|---|
| TryLysC MSlow |
 |
|---|
| Try MShigh |
 |
|---|
| ChTry MShigh |
 |
|---|
| ArgC MShigh |
 |
|---|
| LysN MShigh |
 |
|---|
| TryLysC MShigh |
 |
|---|
General Statistics
Number of major isoforms |
Number of additional isoforms |
Number of all proteins |
Number of amino acids |
Min. Seq. Length |
Max. Seq. Length |
Avg. Seq. Length |
Avg. Mol. Weight |
|---|---|---|---|---|---|---|---|
0 |
10425 |
39 |
875 |
226.6 |
25.28 |
Amino acid frequency
Ala |
Cys |
Asp |
Glu |
Phe |
Gly |
His |
Ile |
Lys |
Leu |
|---|---|---|---|---|---|---|---|---|---|
9.564 ± 0.621 | 1.046 ± 0.175 |
6.053 ± 0.267 | 6.129 ± 0.331 |
3.319 ± 0.234 | 7.089 ± 0.508 |
2.005 ± 0.246 | 5.209 ± 0.248 |
5.266 ± 0.269 | 9.343 ± 0.313 |
Met |
Asn |
Gln |
Pro |
Arg |
Ser |
Thr |
Val |
Trp |
Tyr |
|---|---|---|---|---|---|---|---|---|---|
2.839 ± 0.182 | 4.336 ± 0.223 |
4.029 ± 0.189 | 4.278 ± 0.319 |
6.676 ± 0.411 | 5.928 ± 0.232 |
5.707 ± 0.327 | 6.619 ± 0.3 |
1.621 ± 0.154 | 2.945 ± 0.249 |
Most of the basic statistics you can see at this page can be downloaded from this CSV file
Proteome-pI is available under Creative Commons Attribution-NoDerivs license, for more details see here
| Reference: Kozlowski LP. Proteome-pI 2.0: Proteome Isoelectric Point Database Update. Nucleic Acids Res. 2021, doi: 10.1093/nar/gkab944 | Contact: Lukasz P. Kozlowski |
