Leersia perrieri
Taxonomy: cellular organisms; Eukaryota; Viridiplantae; Streptophyta; Streptophytina; Embryophyta; Tracheophyta; Euphyllophyta; Spermatophyta; Magnoliopsida; Mesangiospermae; Liliopsida; Petrosaviidae; commelinids; Poales; Poaceae; BOP clade; Oryzoideae; Oryzeae; Oryzinae; Leersia
Average proteome isoelectric point is 6.8
Get precalculated fractions of proteins

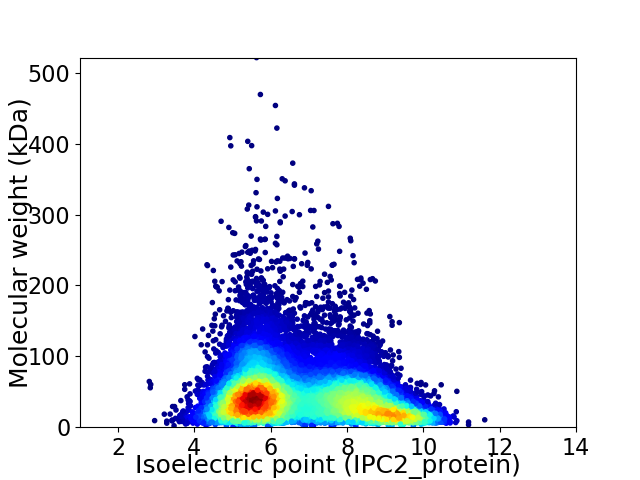
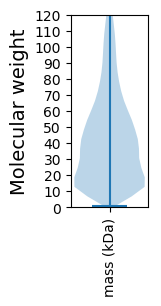
Virtual 2D-PAGE plot for 36779 proteins (isoelectric point calculated using IPC2_protein)
Get csv file with sequences according to given criteria:
* You can choose from 21 different methods for calculating isoelectric point
Summary statistics related to proteome-wise predictions


Protein with the lowest isoelectric point:
>tr|A0A0D9XD02|A0A0D9XD02_9ORYZ NB-ARC domain-containing protein OS=Leersia perrieri OX=77586 PE=4 SV=1
MM1 pKa = 7.83DD2 pKa = 5.24AAANDD7 pKa = 3.68STAADD12 pKa = 3.9QNPTTTPNPNPNPPSAAAAGPDD34 pKa = 3.77DD35 pKa = 4.05SAAAATRR42 pKa = 11.84RR43 pKa = 11.84PFTSLTQEE51 pKa = 4.12EE52 pKa = 4.68ADD54 pKa = 3.55LALARR59 pKa = 11.84VLQEE63 pKa = 3.57QEE65 pKa = 3.57RR66 pKa = 11.84AYY68 pKa = 10.61MMLSGGHH75 pKa = 6.19HH76 pKa = 6.53GGGGEE81 pKa = 4.13YY82 pKa = 10.31AASDD86 pKa = 3.67DD87 pKa = 3.89GGSYY91 pKa = 10.44EE92 pKa = 5.55FDD94 pKa = 3.69YY95 pKa = 11.46DD96 pKa = 5.3DD97 pKa = 6.16DD98 pKa = 7.15DD99 pKa = 6.97GDD101 pKa = 3.93GLEE104 pKa = 4.53GEE106 pKa = 4.69EE107 pKa = 4.43GSDD110 pKa = 3.7YY111 pKa = 11.5DD112 pKa = 4.69EE113 pKa = 5.24EE114 pKa = 6.82DD115 pKa = 3.75GDD117 pKa = 4.29GHH119 pKa = 7.69GEE121 pKa = 3.92APLDD125 pKa = 3.65EE126 pKa = 5.74DD127 pKa = 4.45EE128 pKa = 5.01EE129 pKa = 4.49VGEE132 pKa = 4.63ADD134 pKa = 5.05DD135 pKa = 5.06GGAAAAAAGLDD146 pKa = 3.51PAQYY150 pKa = 11.24DD151 pKa = 3.55DD152 pKa = 5.63DD153 pKa = 4.26EE154 pKa = 6.03AFARR158 pKa = 11.84ALQDD162 pKa = 3.22AEE164 pKa = 4.05EE165 pKa = 4.96RR166 pKa = 11.84EE167 pKa = 4.33VAGRR171 pKa = 11.84LMALAGLTGYY181 pKa = 10.45VDD183 pKa = 3.81PDD185 pKa = 3.4EE186 pKa = 4.53YY187 pKa = 11.33SYY189 pKa = 11.93EE190 pKa = 4.0EE191 pKa = 4.28LVALGEE197 pKa = 4.47VVGTEE202 pKa = 4.31SRR204 pKa = 11.84GLPADD209 pKa = 3.85TLASLPSVTYY219 pKa = 10.46RR220 pKa = 11.84AQDD223 pKa = 3.38KK224 pKa = 10.88QDD226 pKa = 3.6GNMEE230 pKa = 3.85QCVICRR236 pKa = 11.84VEE238 pKa = 4.1FEE240 pKa = 4.31EE241 pKa = 5.51GEE243 pKa = 4.47SLVALPCKK251 pKa = 10.13HH252 pKa = 6.85SYY254 pKa = 10.7HH255 pKa = 7.0SDD257 pKa = 4.29CINQWLQLNKK267 pKa = 9.62VCPMCSAEE275 pKa = 4.16VSTSRR280 pKa = 11.84DD281 pKa = 2.88NRR283 pKa = 11.84AA284 pKa = 2.93
MM1 pKa = 7.83DD2 pKa = 5.24AAANDD7 pKa = 3.68STAADD12 pKa = 3.9QNPTTTPNPNPNPPSAAAAGPDD34 pKa = 3.77DD35 pKa = 4.05SAAAATRR42 pKa = 11.84RR43 pKa = 11.84PFTSLTQEE51 pKa = 4.12EE52 pKa = 4.68ADD54 pKa = 3.55LALARR59 pKa = 11.84VLQEE63 pKa = 3.57QEE65 pKa = 3.57RR66 pKa = 11.84AYY68 pKa = 10.61MMLSGGHH75 pKa = 6.19HH76 pKa = 6.53GGGGEE81 pKa = 4.13YY82 pKa = 10.31AASDD86 pKa = 3.67DD87 pKa = 3.89GGSYY91 pKa = 10.44EE92 pKa = 5.55FDD94 pKa = 3.69YY95 pKa = 11.46DD96 pKa = 5.3DD97 pKa = 6.16DD98 pKa = 7.15DD99 pKa = 6.97GDD101 pKa = 3.93GLEE104 pKa = 4.53GEE106 pKa = 4.69EE107 pKa = 4.43GSDD110 pKa = 3.7YY111 pKa = 11.5DD112 pKa = 4.69EE113 pKa = 5.24EE114 pKa = 6.82DD115 pKa = 3.75GDD117 pKa = 4.29GHH119 pKa = 7.69GEE121 pKa = 3.92APLDD125 pKa = 3.65EE126 pKa = 5.74DD127 pKa = 4.45EE128 pKa = 5.01EE129 pKa = 4.49VGEE132 pKa = 4.63ADD134 pKa = 5.05DD135 pKa = 5.06GGAAAAAAGLDD146 pKa = 3.51PAQYY150 pKa = 11.24DD151 pKa = 3.55DD152 pKa = 5.63DD153 pKa = 4.26EE154 pKa = 6.03AFARR158 pKa = 11.84ALQDD162 pKa = 3.22AEE164 pKa = 4.05EE165 pKa = 4.96RR166 pKa = 11.84EE167 pKa = 4.33VAGRR171 pKa = 11.84LMALAGLTGYY181 pKa = 10.45VDD183 pKa = 3.81PDD185 pKa = 3.4EE186 pKa = 4.53YY187 pKa = 11.33SYY189 pKa = 11.93EE190 pKa = 4.0EE191 pKa = 4.28LVALGEE197 pKa = 4.47VVGTEE202 pKa = 4.31SRR204 pKa = 11.84GLPADD209 pKa = 3.85TLASLPSVTYY219 pKa = 10.46RR220 pKa = 11.84AQDD223 pKa = 3.38KK224 pKa = 10.88QDD226 pKa = 3.6GNMEE230 pKa = 3.85QCVICRR236 pKa = 11.84VEE238 pKa = 4.1FEE240 pKa = 4.31EE241 pKa = 5.51GEE243 pKa = 4.47SLVALPCKK251 pKa = 10.13HH252 pKa = 6.85SYY254 pKa = 10.7HH255 pKa = 7.0SDD257 pKa = 4.29CINQWLQLNKK267 pKa = 9.62VCPMCSAEE275 pKa = 4.16VSTSRR280 pKa = 11.84DD281 pKa = 2.88NRR283 pKa = 11.84AA284 pKa = 2.93
Molecular weight: 30.0 kDa
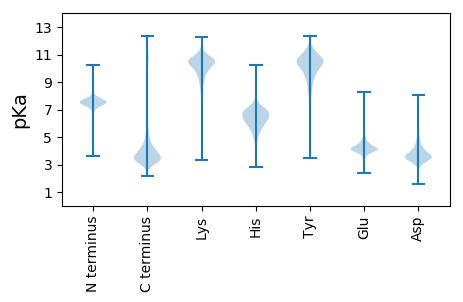
Isoelectric point according different methods:
Protein with the highest isoelectric point:
>tr|A0A0D9WDL8|A0A0D9WDL8_9ORYZ Uncharacterized protein OS=Leersia perrieri OX=77586 PE=4 SV=1
MM1 pKa = 7.56GFGSGITGAPRR12 pKa = 11.84PRR14 pKa = 11.84RR15 pKa = 11.84RR16 pKa = 11.84RR17 pKa = 11.84RR18 pKa = 11.84RR19 pKa = 11.84AGRR22 pKa = 11.84TPRR25 pKa = 11.84VLLSARR31 pKa = 3.72
MM1 pKa = 7.56GFGSGITGAPRR12 pKa = 11.84PRR14 pKa = 11.84RR15 pKa = 11.84RR16 pKa = 11.84RR17 pKa = 11.84RR18 pKa = 11.84RR19 pKa = 11.84AGRR22 pKa = 11.84TPRR25 pKa = 11.84VLLSARR31 pKa = 3.72
Molecular weight: 3.46 kDa
Isoelectric point according different methods:
Peptides (in silico digests for buttom-up proteomics)
Below you can find in silico digests of the whole proteome with Trypsin, Chymotrypsin, Trypsin+LysC, LysN, ArgC proteases suitable for different mass spec machines.| Try ESI |
 |
|---|
| ChTry ESI |
 |
|---|
| ArgC ESI |
 |
|---|
| LysN ESI |
 |
|---|
| TryLysC ESI |
 |
|---|
| Try MALDI |
 |
|---|
| ChTry MALDI |
 |
|---|
| ArgC MALDI |
 |
|---|
| LysN MALDI |
 |
|---|
| TryLysC MALDI |
 |
|---|
| Try LTQ |
 |
|---|
| ChTry LTQ |
 |
|---|
| ArgC LTQ |
 |
|---|
| LysN LTQ |
 |
|---|
| TryLysC LTQ |
 |
|---|
| Try MSlow |
 |
|---|
| ChTry MSlow |
 |
|---|
| ArgC MSlow |
 |
|---|
| LysN MSlow |
 |
|---|
| TryLysC MSlow |
 |
|---|
| Try MShigh |
 |
|---|
| ChTry MShigh |
 |
|---|
| ArgC MShigh |
 |
|---|
| LysN MShigh |
 |
|---|
| TryLysC MShigh |
 |
|---|
General Statistics
Number of major isoforms |
Number of additional isoforms |
Number of all proteins |
Number of amino acids |
Min. Seq. Length |
Max. Seq. Length |
Avg. Seq. Length |
Avg. Mol. Weight |
|---|---|---|---|---|---|---|---|
16268560 |
7 |
5221 |
442.3 |
48.78 |
Amino acid frequency
Ala |
Cys |
Asp |
Glu |
Phe |
Gly |
His |
Ile |
Lys |
Leu |
|---|---|---|---|---|---|---|---|---|---|
8.771 ± 0.017 | 1.9 ± 0.007 |
5.484 ± 0.008 | 6.068 ± 0.014 |
3.723 ± 0.008 | 7.165 ± 0.013 |
2.486 ± 0.006 | 4.706 ± 0.009 |
5.063 ± 0.012 | 9.556 ± 0.017 |
Met |
Asn |
Gln |
Pro |
Arg |
Ser |
Thr |
Val |
Trp |
Tyr |
|---|---|---|---|---|---|---|---|---|---|
2.473 ± 0.005 | 3.736 ± 0.009 |
5.373 ± 0.013 | 3.436 ± 0.01 |
6.109 ± 0.009 | 8.395 ± 0.014 |
4.882 ± 0.007 | 6.758 ± 0.009 |
1.285 ± 0.005 | 2.629 ± 0.008 |
Most of the basic statistics you can see at this page can be downloaded from this CSV file
Proteome-pI is available under Creative Commons Attribution-NoDerivs license, for more details see here
| Reference: Kozlowski LP. Proteome-pI 2.0: Proteome Isoelectric Point Database Update. Nucleic Acids Res. 2021, doi: 10.1093/nar/gkab944 | Contact: Lukasz P. Kozlowski |
