Erwinia phage vB_EamM_Asesino
Taxonomy: Viruses; Duplodnaviria; Heunggongvirae; Uroviricota; Caudoviricetes; Caudovirales; Myoviridae; Erskinevirus; Erwinia virus Asesino
Average proteome isoelectric point is 6.15
Get precalculated fractions of proteins
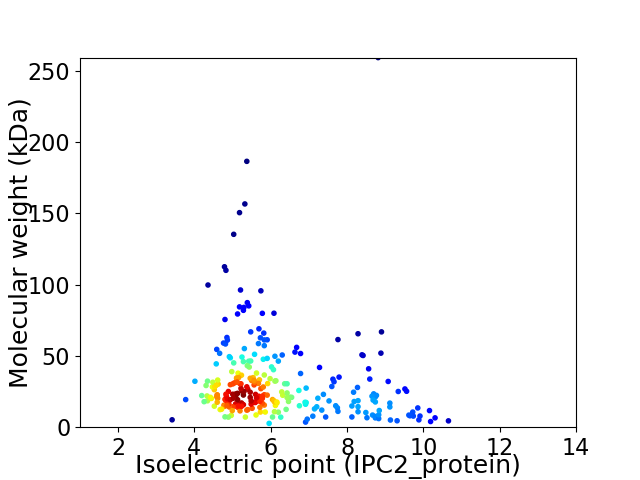
Virtual 2D-PAGE plot for 277 proteins (isoelectric point calculated using IPC2_protein)
Get csv file with sequences according to given criteria:
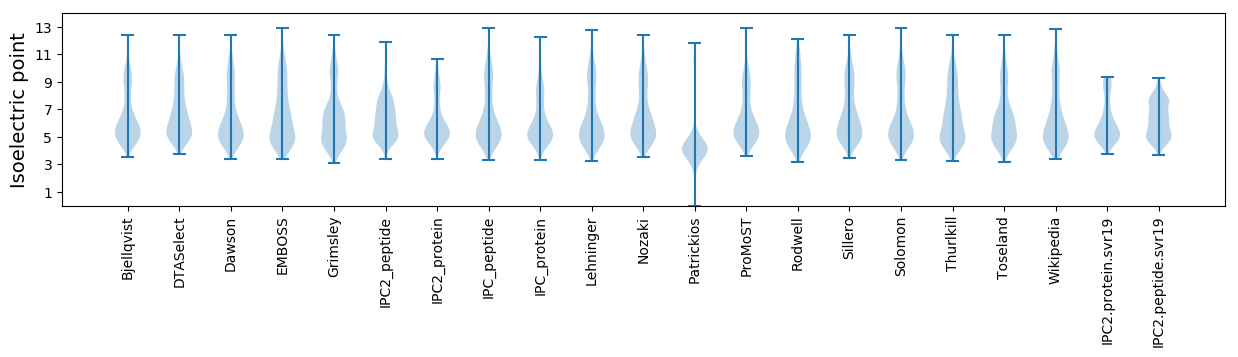
* You can choose from 21 different methods for calculating isoelectric point
Summary statistics related to proteome-wise predictions
Protein with the lowest isoelectric point:
>tr|A0A1B2I9Z5|A0A1B2I9Z5_9CAUD Uncharacterized protein OS=Erwinia phage vB_EamM_Asesino OX=1883370 GN=ASESINO_86 PE=4 SV=1
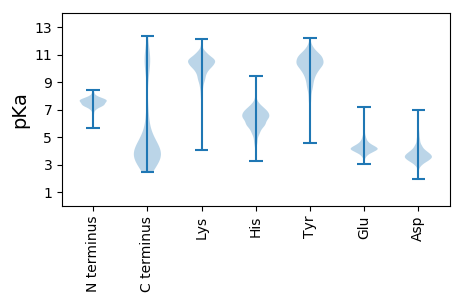
MM1 pKa = 7.57IDD3 pKa = 3.54IYY5 pKa = 10.96TDD7 pKa = 3.37YY8 pKa = 11.55AAVLTVNRR16 pKa = 11.84HH17 pKa = 4.88EE18 pKa = 5.16DD19 pKa = 3.08RR20 pKa = 11.84AAPMLDD26 pKa = 3.7LVTLGIDD33 pKa = 3.21YY34 pKa = 10.23GYY36 pKa = 11.05DD37 pKa = 3.14VALSDD42 pKa = 4.81VYY44 pKa = 10.72FEE46 pKa = 4.98PSADD50 pKa = 3.74PADD53 pKa = 3.55EE54 pKa = 4.47TIRR57 pKa = 11.84LEE59 pKa = 4.49GIIVKK64 pKa = 10.21CAVALGNRR72 pKa = 11.84LGVALNPQIVYY83 pKa = 9.2QKK85 pKa = 9.79PKK87 pKa = 7.49EE88 pKa = 4.29TVRR91 pKa = 11.84ILHH94 pKa = 6.25GLLEE98 pKa = 4.32TFEE101 pKa = 5.81DD102 pKa = 4.81FDD104 pKa = 6.94DD105 pKa = 4.35SDD107 pKa = 3.84SLYY110 pKa = 10.66GIVMSGEE117 pKa = 3.98TPEE120 pKa = 5.32FILEE124 pKa = 4.05NMCRR128 pKa = 11.84LVYY131 pKa = 10.75GDD133 pKa = 4.32NNLHH137 pKa = 6.63FEE139 pKa = 4.22DD140 pKa = 5.32LIVRR144 pKa = 11.84VGPRR148 pKa = 11.84VMTVMRR154 pKa = 11.84NYY156 pKa = 10.32LAASALDD163 pKa = 3.87EE164 pKa = 4.27QKK166 pKa = 11.39GDD168 pKa = 3.38NDD170 pKa = 3.48YY171 pKa = 11.63LRR173 pKa = 11.84IGRR176 pKa = 11.84IAAYY180 pKa = 10.42LRR182 pKa = 11.84VFPQNPSAFVFLNLPQEE199 pKa = 4.33PDD201 pKa = 3.43LQVVQQSFTFDD212 pKa = 3.17EE213 pKa = 4.35EE214 pKa = 4.63EE215 pKa = 4.29YY216 pKa = 10.76PEE218 pKa = 5.88DD219 pKa = 4.31EE220 pKa = 4.58LLLMYY225 pKa = 10.59SVGLSVIPADD235 pKa = 3.91TYY237 pKa = 10.76EE238 pKa = 4.31DD239 pKa = 4.01AYY241 pKa = 10.99AALAGNLEE249 pKa = 4.14KK250 pKa = 11.02LNTDD254 pKa = 4.5GYY256 pKa = 9.0PALPILEE263 pKa = 4.27QGMAALKK270 pKa = 9.58TIYY273 pKa = 10.48GHH275 pKa = 7.4DD276 pKa = 3.27NVTEE280 pKa = 4.06EE281 pKa = 4.25EE282 pKa = 4.48NYY284 pKa = 10.46EE285 pKa = 3.83QDD287 pKa = 3.06
MM1 pKa = 7.57IDD3 pKa = 3.54IYY5 pKa = 10.96TDD7 pKa = 3.37YY8 pKa = 11.55AAVLTVNRR16 pKa = 11.84HH17 pKa = 4.88EE18 pKa = 5.16DD19 pKa = 3.08RR20 pKa = 11.84AAPMLDD26 pKa = 3.7LVTLGIDD33 pKa = 3.21YY34 pKa = 10.23GYY36 pKa = 11.05DD37 pKa = 3.14VALSDD42 pKa = 4.81VYY44 pKa = 10.72FEE46 pKa = 4.98PSADD50 pKa = 3.74PADD53 pKa = 3.55EE54 pKa = 4.47TIRR57 pKa = 11.84LEE59 pKa = 4.49GIIVKK64 pKa = 10.21CAVALGNRR72 pKa = 11.84LGVALNPQIVYY83 pKa = 9.2QKK85 pKa = 9.79PKK87 pKa = 7.49EE88 pKa = 4.29TVRR91 pKa = 11.84ILHH94 pKa = 6.25GLLEE98 pKa = 4.32TFEE101 pKa = 5.81DD102 pKa = 4.81FDD104 pKa = 6.94DD105 pKa = 4.35SDD107 pKa = 3.84SLYY110 pKa = 10.66GIVMSGEE117 pKa = 3.98TPEE120 pKa = 5.32FILEE124 pKa = 4.05NMCRR128 pKa = 11.84LVYY131 pKa = 10.75GDD133 pKa = 4.32NNLHH137 pKa = 6.63FEE139 pKa = 4.22DD140 pKa = 5.32LIVRR144 pKa = 11.84VGPRR148 pKa = 11.84VMTVMRR154 pKa = 11.84NYY156 pKa = 10.32LAASALDD163 pKa = 3.87EE164 pKa = 4.27QKK166 pKa = 11.39GDD168 pKa = 3.38NDD170 pKa = 3.48YY171 pKa = 11.63LRR173 pKa = 11.84IGRR176 pKa = 11.84IAAYY180 pKa = 10.42LRR182 pKa = 11.84VFPQNPSAFVFLNLPQEE199 pKa = 4.33PDD201 pKa = 3.43LQVVQQSFTFDD212 pKa = 3.17EE213 pKa = 4.35EE214 pKa = 4.63EE215 pKa = 4.29YY216 pKa = 10.76PEE218 pKa = 5.88DD219 pKa = 4.31EE220 pKa = 4.58LLLMYY225 pKa = 10.59SVGLSVIPADD235 pKa = 3.91TYY237 pKa = 10.76EE238 pKa = 4.31DD239 pKa = 4.01AYY241 pKa = 10.99AALAGNLEE249 pKa = 4.14KK250 pKa = 11.02LNTDD254 pKa = 4.5GYY256 pKa = 9.0PALPILEE263 pKa = 4.27QGMAALKK270 pKa = 9.58TIYY273 pKa = 10.48GHH275 pKa = 7.4DD276 pKa = 3.27NVTEE280 pKa = 4.06EE281 pKa = 4.25EE282 pKa = 4.48NYY284 pKa = 10.46EE285 pKa = 3.83QDD287 pKa = 3.06
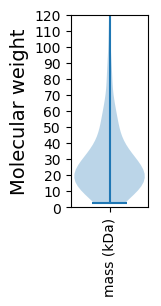
Molecular weight: 32.23 kDa
Isoelectric point according different methods:
Protein with the highest isoelectric point:
>tr|A0A1B2IA83|A0A1B2IA83_9CAUD Site-specific DNA-methyltransferase (adenine-specific) OS=Erwinia phage vB_EamM_Asesino OX=1883370 GN=ASESINO_121 PE=3 SV=1
MM1 pKa = 7.54KK2 pKa = 10.28FFFVVVVIFCIGAVLRR18 pKa = 11.84SFLRR22 pKa = 11.84YY23 pKa = 8.99LRR25 pKa = 11.84HH26 pKa = 5.9RR27 pKa = 11.84QRR29 pKa = 11.84AHH31 pKa = 7.79LAQQLNAYY39 pKa = 8.61RR40 pKa = 11.84QVSEE44 pKa = 4.1YY45 pKa = 10.33VDD47 pKa = 3.05RR48 pKa = 11.84AGRR51 pKa = 11.84EE52 pKa = 3.42KK53 pKa = 10.62WMMVICFLIGLWCTIKK69 pKa = 10.85LFNN72 pKa = 5.02
MM1 pKa = 7.54KK2 pKa = 10.28FFFVVVVIFCIGAVLRR18 pKa = 11.84SFLRR22 pKa = 11.84YY23 pKa = 8.99LRR25 pKa = 11.84HH26 pKa = 5.9RR27 pKa = 11.84QRR29 pKa = 11.84AHH31 pKa = 7.79LAQQLNAYY39 pKa = 8.61RR40 pKa = 11.84QVSEE44 pKa = 4.1YY45 pKa = 10.33VDD47 pKa = 3.05RR48 pKa = 11.84AGRR51 pKa = 11.84EE52 pKa = 3.42KK53 pKa = 10.62WMMVICFLIGLWCTIKK69 pKa = 10.85LFNN72 pKa = 5.02
Molecular weight: 8.7 kDa
Isoelectric point according different methods:
Peptides (in silico digests for buttom-up proteomics)
Below you can find in silico digests of the whole proteome with Trypsin, Chymotrypsin, Trypsin+LysC, LysN, ArgC proteases suitable for different mass spec machines.| Try ESI |
 |
|---|
| ChTry ESI |
|
|---|
| ArgC ESI |
|
|---|
| LysN ESI |
|
|---|
| TryLysC ESI |
|
|---|
| Try MALDI |
|
|---|
| ChTry MALDI |
|
|---|
| ArgC MALDI |
|
|---|
| LysN MALDI |
|
|---|
| TryLysC MALDI |
|
|---|
| Try LTQ |
|
|---|
| ChTry LTQ |
|
|---|
| ArgC LTQ |
|
|---|
| LysN LTQ |
|
|---|
| TryLysC LTQ |
|
|---|
| Try MSlow |
|
|---|
| ChTry MSlow |
|
|---|
| ArgC MSlow |
|
|---|
| LysN MSlow |
|
|---|
| TryLysC MSlow |
|
|---|
| Try MShigh |
|
|---|
| ChTry MShigh |
|
|---|
| ArgC MShigh |
|
|---|
| LysN MShigh |
|
|---|
| TryLysC MShigh |
|
|---|
General Statistics
Number of major isoforms |
Number of additional isoforms |
Number of all proteins |
Number of amino acids |
Min. Seq. Length |
Max. Seq. Length |
Avg. Seq. Length |
Avg. Mol. Weight |
|---|---|---|---|---|---|---|---|
0 |
77544 |
22 |
2379 |
279.9 |
31.43 |
Amino acid frequency
Ala |
Cys |
Asp |
Glu |
Phe |
Gly |
His |
Ile |
Lys |
Leu |
|---|---|---|---|---|---|---|---|---|---|
7.993 ± 0.19 | 0.914 ± 0.064 |
6.387 ± 0.106 | 6.141 ± 0.156 |
4.042 ± 0.074 | 6.768 ± 0.195 |
2.062 ± 0.097 | 5.326 ± 0.103 |
5.384 ± 0.135 | 9.004 ± 0.129 |
Met |
Asn |
Gln |
Pro |
Arg |
Ser |
Thr |
Val |
Trp |
Tyr |
|---|---|---|---|---|---|---|---|---|---|
2.752 ± 0.067 | 4.897 ± 0.091 |
4.435 ± 0.089 | 3.76 ± 0.086 |
5.441 ± 0.128 | 5.678 ± 0.105 |
6.413 ± 0.146 | 7.2 ± 0.111 |
1.515 ± 0.054 | 3.887 ± 0.095 |
Most of the basic statistics you can see at this page can be downloaded from this CSV file
See this proteome in:

Proteome-pI is available under Creative Commons Attribution-NoDerivs license, for more details see here
| Reference: Kozlowski LP. Proteome-pI 2.0: Proteome Isoelectric Point Database Update. Nucleic Acids Res. 2021, doi: 10.1093/nar/gkab944 | Contact: Lukasz P. Kozlowski |