Acetanaerobacterium elongatum
Taxonomy: cellular organisms; Bacteria; Terrabacteria group; Firmicutes; Clostridia; Eubacteriales; Oscillospiraceae; Acetanaerobacterium
Average proteome isoelectric point is 6.37
Get precalculated fractions of proteins

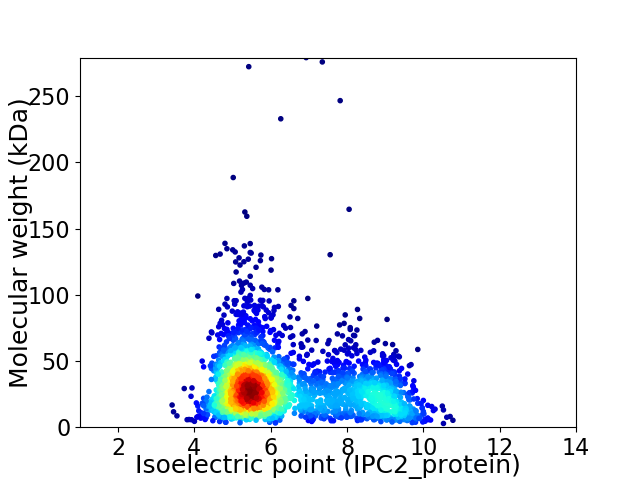
Virtual 2D-PAGE plot for 2758 proteins (isoelectric point calculated using IPC2_protein)
Get csv file with sequences according to given criteria:
* You can choose from 21 different methods for calculating isoelectric point
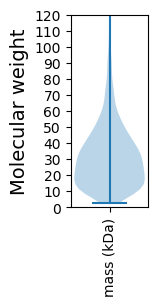
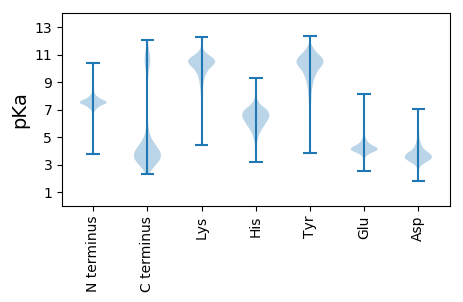
Summary statistics related to proteome-wise predictions


Protein with the lowest isoelectric point:
>tr|A0A1G9U2Q3|A0A1G9U2Q3_9FIRM X-X-X-Leu-X-X-Gly heptad repeat-containing protein OS=Acetanaerobacterium elongatum OX=258515 GN=SAMN05192585_10155 PE=4 SV=1
MM1 pKa = 7.43NNLVFNTTAAEE12 pKa = 4.26LKK14 pKa = 9.61TSVYY18 pKa = 9.96AQKK21 pKa = 10.89SDD23 pKa = 3.68DD24 pKa = 3.91SFAAIQIDD32 pKa = 3.69NSGNLYY38 pKa = 10.92VNVSNTSLTVAGSVTINNTDD58 pKa = 3.27LSIAGDD64 pKa = 3.57VTITNTSLTVAGSVTINNTDD84 pKa = 3.31LSVAGDD90 pKa = 3.53VTITNTSLTVAGSVTVNNATITTFVNGSRR119 pKa = 11.84LTTITLSSSAVTSNTILLDD138 pKa = 3.67NSDD141 pKa = 2.67ISQYY145 pKa = 11.16KK146 pKa = 8.81NAAFMLYY153 pKa = 10.18NEE155 pKa = 4.42STATLVTLNLQVSPTDD171 pKa = 3.24TTTDD175 pKa = 3.91YY176 pKa = 10.48ITDD179 pKa = 3.75TTLGTVTLAANGKK192 pKa = 9.7LYY194 pKa = 10.52IPVSVVGKK202 pKa = 8.93NVRR205 pKa = 11.84LLATSASDD213 pKa = 3.32TVTVNGYY220 pKa = 9.47YY221 pKa = 9.94VAQAA225 pKa = 3.47
MM1 pKa = 7.43NNLVFNTTAAEE12 pKa = 4.26LKK14 pKa = 9.61TSVYY18 pKa = 9.96AQKK21 pKa = 10.89SDD23 pKa = 3.68DD24 pKa = 3.91SFAAIQIDD32 pKa = 3.69NSGNLYY38 pKa = 10.92VNVSNTSLTVAGSVTINNTDD58 pKa = 3.27LSIAGDD64 pKa = 3.57VTITNTSLTVAGSVTINNTDD84 pKa = 3.31LSVAGDD90 pKa = 3.53VTITNTSLTVAGSVTVNNATITTFVNGSRR119 pKa = 11.84LTTITLSSSAVTSNTILLDD138 pKa = 3.67NSDD141 pKa = 2.67ISQYY145 pKa = 11.16KK146 pKa = 8.81NAAFMLYY153 pKa = 10.18NEE155 pKa = 4.42STATLVTLNLQVSPTDD171 pKa = 3.24TTTDD175 pKa = 3.91YY176 pKa = 10.48ITDD179 pKa = 3.75TTLGTVTLAANGKK192 pKa = 9.7LYY194 pKa = 10.52IPVSVVGKK202 pKa = 8.93NVRR205 pKa = 11.84LLATSASDD213 pKa = 3.32TVTVNGYY220 pKa = 9.47YY221 pKa = 9.94VAQAA225 pKa = 3.47
Molecular weight: 23.32 kDa
Isoelectric point according different methods:
Protein with the highest isoelectric point:
>tr|A0A1H0GZT3|A0A1H0GZT3_9FIRM Transcriptional regulator LacI family OS=Acetanaerobacterium elongatum OX=258515 GN=SAMN05192585_15810 PE=4 SV=1
MM1 pKa = 7.67EE2 pKa = 4.87LQKK5 pKa = 10.84PSIRR9 pKa = 11.84LLYY12 pKa = 10.12AWWLALFCATLVLCCAAASLLSFSRR37 pKa = 11.84PLWVWVTVVLLAVFSAGFIWVLPQRR62 pKa = 11.84YY63 pKa = 8.45RR64 pKa = 11.84RR65 pKa = 11.84LAYY68 pKa = 9.54GVKK71 pKa = 10.1GSLVMVRR78 pKa = 11.84CGIIGVRR85 pKa = 11.84EE86 pKa = 3.91KK87 pKa = 11.26YY88 pKa = 10.36ILVEE92 pKa = 4.22NIRR95 pKa = 11.84FASMDD100 pKa = 3.1ATLPLAAFGLATATLRR116 pKa = 11.84TAGATLRR123 pKa = 11.84IPGLDD128 pKa = 3.14ADD130 pKa = 3.77AQKK133 pKa = 10.91RR134 pKa = 11.84LKK136 pKa = 10.55AQLSPSFGRR145 pKa = 3.98
MM1 pKa = 7.67EE2 pKa = 4.87LQKK5 pKa = 10.84PSIRR9 pKa = 11.84LLYY12 pKa = 10.12AWWLALFCATLVLCCAAASLLSFSRR37 pKa = 11.84PLWVWVTVVLLAVFSAGFIWVLPQRR62 pKa = 11.84YY63 pKa = 8.45RR64 pKa = 11.84RR65 pKa = 11.84LAYY68 pKa = 9.54GVKK71 pKa = 10.1GSLVMVRR78 pKa = 11.84CGIIGVRR85 pKa = 11.84EE86 pKa = 3.91KK87 pKa = 11.26YY88 pKa = 10.36ILVEE92 pKa = 4.22NIRR95 pKa = 11.84FASMDD100 pKa = 3.1ATLPLAAFGLATATLRR116 pKa = 11.84TAGATLRR123 pKa = 11.84IPGLDD128 pKa = 3.14ADD130 pKa = 3.77AQKK133 pKa = 10.91RR134 pKa = 11.84LKK136 pKa = 10.55AQLSPSFGRR145 pKa = 3.98
Molecular weight: 16.02 kDa
Isoelectric point according different methods:
Peptides (in silico digests for buttom-up proteomics)
Below you can find in silico digests of the whole proteome with Trypsin, Chymotrypsin, Trypsin+LysC, LysN, ArgC proteases suitable for different mass spec machines.| Try ESI |
 |
|---|
| ChTry ESI |
 |
|---|
| ArgC ESI |
 |
|---|
| LysN ESI |
 |
|---|
| TryLysC ESI |
 |
|---|
| Try MALDI |
 |
|---|
| ChTry MALDI |
 |
|---|
| ArgC MALDI |
 |
|---|
| LysN MALDI |
 |
|---|
| TryLysC MALDI |
 |
|---|
| Try LTQ |
 |
|---|
| ChTry LTQ |
 |
|---|
| ArgC LTQ |
 |
|---|
| LysN LTQ |
 |
|---|
| TryLysC LTQ |
 |
|---|
| Try MSlow |
 |
|---|
| ChTry MSlow |
 |
|---|
| ArgC MSlow |
 |
|---|
| LysN MSlow |
 |
|---|
| TryLysC MSlow |
 |
|---|
| Try MShigh |
 |
|---|
| ChTry MShigh |
 |
|---|
| ArgC MShigh |
 |
|---|
| LysN MShigh |
 |
|---|
| TryLysC MShigh |
 |
|---|
General Statistics
Number of major isoforms |
Number of additional isoforms |
Number of all proteins |
Number of amino acids |
Min. Seq. Length |
Max. Seq. Length |
Avg. Seq. Length |
Avg. Mol. Weight |
|---|---|---|---|---|---|---|---|
0 |
829626 |
24 |
2639 |
300.8 |
33.27 |
Amino acid frequency
Ala |
Cys |
Asp |
Glu |
Phe |
Gly |
His |
Ile |
Lys |
Leu |
|---|---|---|---|---|---|---|---|---|---|
8.779 ± 0.062 | 1.505 ± 0.021 |
5.156 ± 0.036 | 6.351 ± 0.05 |
4.106 ± 0.038 | 7.213 ± 0.051 |
1.597 ± 0.02 | 7.099 ± 0.044 |
6.229 ± 0.041 | 9.661 ± 0.063 |
Met |
Asn |
Gln |
Pro |
Arg |
Ser |
Thr |
Val |
Trp |
Tyr |
|---|---|---|---|---|---|---|---|---|---|
2.623 ± 0.024 | 4.361 ± 0.031 |
3.751 ± 0.031 | 3.305 ± 0.025 |
4.475 ± 0.039 | 6.328 ± 0.053 |
5.83 ± 0.054 | 7.056 ± 0.038 |
0.8 ± 0.016 | 3.773 ± 0.029 |
Most of the basic statistics you can see at this page can be downloaded from this CSV file
Proteome-pI is available under Creative Commons Attribution-NoDerivs license, for more details see here
| Reference: Kozlowski LP. Proteome-pI 2.0: Proteome Isoelectric Point Database Update. Nucleic Acids Res. 2021, doi: 10.1093/nar/gkab944 | Contact: Lukasz P. Kozlowski |
