Methylobacterium sp. (strain 4-46)
Taxonomy: cellular organisms; Bacteria; Proteobacteria; Alphaproteobacteria; Hyphomicrobiales; Methylobacteriaceae; Methylobacterium; unclassified Methylobacterium
Average proteome isoelectric point is 7.17
Get precalculated fractions of proteins

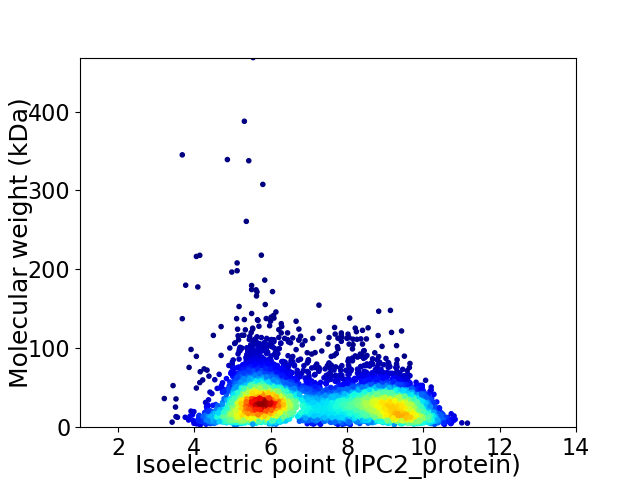
Virtual 2D-PAGE plot for 6647 proteins (isoelectric point calculated using IPC2_protein)
Get csv file with sequences according to given criteria:
* You can choose from 21 different methods for calculating isoelectric point
Summary statistics related to proteome-wise predictions


Protein with the lowest isoelectric point:
>tr|B0UR86|B0UR86_METS4 Uncharacterized protein OS=Methylobacterium sp. (strain 4-46) OX=426117 GN=M446_6966 PE=4 SV=1
MM1 pKa = 7.46SGSGNDD7 pKa = 3.8QIAGGYY13 pKa = 10.29GNDD16 pKa = 4.77LIDD19 pKa = 4.54GGGGDD24 pKa = 5.11DD25 pKa = 4.67VIASGGNADD34 pKa = 4.44LATGRR39 pKa = 11.84DD40 pKa = 3.47TVYY43 pKa = 11.01GGGGSDD49 pKa = 3.76VIYY52 pKa = 9.74WAYY55 pKa = 9.67DD56 pKa = 3.34TTGSLLYY63 pKa = 10.89GDD65 pKa = 5.2AGDD68 pKa = 4.24GAADD72 pKa = 4.19GGNDD76 pKa = 4.04TITGGSGNDD85 pKa = 3.6TIFGEE90 pKa = 4.9GGDD93 pKa = 3.53NYY95 pKa = 10.38IRR97 pKa = 11.84GGKK100 pKa = 10.07GNDD103 pKa = 3.93AIDD106 pKa = 4.05GGSGNDD112 pKa = 3.75TIRR115 pKa = 11.84GSGGEE120 pKa = 4.18GMDD123 pKa = 3.75TVHH126 pKa = 6.74GGSGNDD132 pKa = 3.91LITYY136 pKa = 6.81TTDD139 pKa = 2.86ASSVRR144 pKa = 11.84LFGDD148 pKa = 3.59AGDD151 pKa = 4.3DD152 pKa = 4.18SIAGGYY158 pKa = 9.1GADD161 pKa = 3.57TLIGGVGNDD170 pKa = 3.8TLSGGLGADD179 pKa = 3.19SFVFGANDD187 pKa = 3.57GTDD190 pKa = 3.26VVRR193 pKa = 11.84DD194 pKa = 4.15FSVGQGDD201 pKa = 4.82KK202 pKa = 10.43IALIAGTTAEE212 pKa = 4.69KK213 pKa = 10.76SRR215 pKa = 11.84ASDD218 pKa = 4.04GFLQLNFYY226 pKa = 11.09DD227 pKa = 3.92SGHH230 pKa = 5.59VLGGSVEE237 pKa = 4.39LYY239 pKa = 9.83GVSYY243 pKa = 8.81NTNLNNVLVQAPSSMTAA260 pKa = 2.94
MM1 pKa = 7.46SGSGNDD7 pKa = 3.8QIAGGYY13 pKa = 10.29GNDD16 pKa = 4.77LIDD19 pKa = 4.54GGGGDD24 pKa = 5.11DD25 pKa = 4.67VIASGGNADD34 pKa = 4.44LATGRR39 pKa = 11.84DD40 pKa = 3.47TVYY43 pKa = 11.01GGGGSDD49 pKa = 3.76VIYY52 pKa = 9.74WAYY55 pKa = 9.67DD56 pKa = 3.34TTGSLLYY63 pKa = 10.89GDD65 pKa = 5.2AGDD68 pKa = 4.24GAADD72 pKa = 4.19GGNDD76 pKa = 4.04TITGGSGNDD85 pKa = 3.6TIFGEE90 pKa = 4.9GGDD93 pKa = 3.53NYY95 pKa = 10.38IRR97 pKa = 11.84GGKK100 pKa = 10.07GNDD103 pKa = 3.93AIDD106 pKa = 4.05GGSGNDD112 pKa = 3.75TIRR115 pKa = 11.84GSGGEE120 pKa = 4.18GMDD123 pKa = 3.75TVHH126 pKa = 6.74GGSGNDD132 pKa = 3.91LITYY136 pKa = 6.81TTDD139 pKa = 2.86ASSVRR144 pKa = 11.84LFGDD148 pKa = 3.59AGDD151 pKa = 4.3DD152 pKa = 4.18SIAGGYY158 pKa = 9.1GADD161 pKa = 3.57TLIGGVGNDD170 pKa = 3.8TLSGGLGADD179 pKa = 3.19SFVFGANDD187 pKa = 3.57GTDD190 pKa = 3.26VVRR193 pKa = 11.84DD194 pKa = 4.15FSVGQGDD201 pKa = 4.82KK202 pKa = 10.43IALIAGTTAEE212 pKa = 4.69KK213 pKa = 10.76SRR215 pKa = 11.84ASDD218 pKa = 4.04GFLQLNFYY226 pKa = 11.09DD227 pKa = 3.92SGHH230 pKa = 5.59VLGGSVEE237 pKa = 4.39LYY239 pKa = 9.83GVSYY243 pKa = 8.81NTNLNNVLVQAPSSMTAA260 pKa = 2.94
Molecular weight: 25.52 kDa
Isoelectric point according different methods:
Protein with the highest isoelectric point:
>tr|B0UFL7|B0UFL7_METS4 ATPase associated with various cellular activities AAA_3 OS=Methylobacterium sp. (strain 4-46) OX=426117 GN=M446_1201 PE=4 SV=1
MM1 pKa = 8.05RR2 pKa = 11.84ILSIAATILTVLTVLILSAAFRR24 pKa = 11.84LTLAPLRR31 pKa = 11.84AVRR34 pKa = 11.84GLKK37 pKa = 9.95LRR39 pKa = 11.84RR40 pKa = 11.84QVTGPAAPAAVRR52 pKa = 3.66
MM1 pKa = 8.05RR2 pKa = 11.84ILSIAATILTVLTVLILSAAFRR24 pKa = 11.84LTLAPLRR31 pKa = 11.84AVRR34 pKa = 11.84GLKK37 pKa = 9.95LRR39 pKa = 11.84RR40 pKa = 11.84QVTGPAAPAAVRR52 pKa = 3.66
Molecular weight: 5.52 kDa
Isoelectric point according different methods:
Peptides (in silico digests for buttom-up proteomics)
Below you can find in silico digests of the whole proteome with Trypsin, Chymotrypsin, Trypsin+LysC, LysN, ArgC proteases suitable for different mass spec machines.| Try ESI |
 |
|---|
| ChTry ESI |
 |
|---|
| ArgC ESI |
 |
|---|
| LysN ESI |
 |
|---|
| TryLysC ESI |
 |
|---|
| Try MALDI |
 |
|---|
| ChTry MALDI |
 |
|---|
| ArgC MALDI |
 |
|---|
| LysN MALDI |
 |
|---|
| TryLysC MALDI |
 |
|---|
| Try LTQ |
 |
|---|
| ChTry LTQ |
 |
|---|
| ArgC LTQ |
 |
|---|
| LysN LTQ |
 |
|---|
| TryLysC LTQ |
 |
|---|
| Try MSlow |
 |
|---|
| ChTry MSlow |
 |
|---|
| ArgC MSlow |
 |
|---|
| LysN MSlow |
 |
|---|
| TryLysC MSlow |
 |
|---|
| Try MShigh |
 |
|---|
| ChTry MShigh |
 |
|---|
| ArgC MShigh |
 |
|---|
| LysN MShigh |
 |
|---|
| TryLysC MShigh |
 |
|---|
General Statistics
Number of major isoforms |
Number of additional isoforms |
Number of all proteins |
Number of amino acids |
Min. Seq. Length |
Max. Seq. Length |
Avg. Seq. Length |
Avg. Mol. Weight |
|---|---|---|---|---|---|---|---|
0 |
2076946 |
29 |
4855 |
312.5 |
33.45 |
Amino acid frequency
Ala |
Cys |
Asp |
Glu |
Phe |
Gly |
His |
Ile |
Lys |
Leu |
|---|---|---|---|---|---|---|---|---|---|
15.045 ± 0.057 | 0.833 ± 0.01 |
5.244 ± 0.023 | 5.508 ± 0.031 |
3.28 ± 0.018 | 9.232 ± 0.035 |
1.89 ± 0.014 | 4.079 ± 0.02 |
2.095 ± 0.023 | 10.821 ± 0.036 |
Met |
Asn |
Gln |
Pro |
Arg |
Ser |
Thr |
Val |
Trp |
Tyr |
|---|---|---|---|---|---|---|---|---|---|
1.927 ± 0.014 | 1.917 ± 0.017 |
6.14 ± 0.034 | 2.705 ± 0.019 |
8.779 ± 0.038 | 4.737 ± 0.028 |
4.975 ± 0.032 | 7.569 ± 0.022 |
1.259 ± 0.012 | 1.965 ± 0.017 |
Most of the basic statistics you can see at this page can be downloaded from this CSV file
Proteome-pI is available under Creative Commons Attribution-NoDerivs license, for more details see here
| Reference: Kozlowski LP. Proteome-pI 2.0: Proteome Isoelectric Point Database Update. Nucleic Acids Res. 2021, doi: 10.1093/nar/gkab944 | Contact: Lukasz P. Kozlowski |
