Microbacterium aurum
Taxonomy: cellular organisms; Bacteria; Terrabacteria group; Actinobacteria; Actinomycetia; Micrococcales; Microbacteriaceae; Microbacterium
Average proteome isoelectric point is 6.1
Get precalculated fractions of proteins

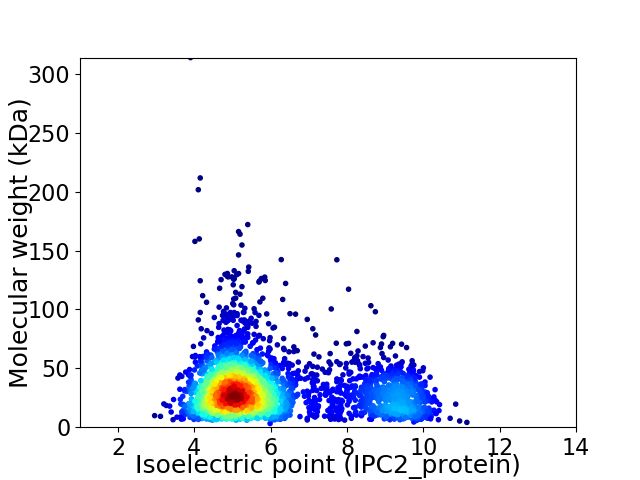
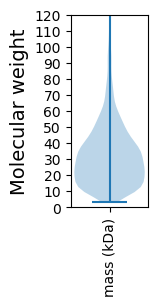
Virtual 2D-PAGE plot for 3054 proteins (isoelectric point calculated using IPC2_protein)
Get csv file with sequences according to given criteria:
* You can choose from 21 different methods for calculating isoelectric point
Summary statistics related to proteome-wise predictions


Protein with the lowest isoelectric point:
>tr|A0A1P8U5L6|A0A1P8U5L6_9MICO Uncharacterized protein OS=Microbacterium aurum OX=36805 GN=BOH66_03165 PE=4 SV=1
MM1 pKa = 7.3RR2 pKa = 11.84TKK4 pKa = 10.43KK5 pKa = 10.7VLGITAGLAAALLVAGCSGGGGSGDD30 pKa = 3.48GDD32 pKa = 3.74GSQDD36 pKa = 3.26QHH38 pKa = 4.68VTLWLYY44 pKa = 10.22PILADD49 pKa = 3.74EE50 pKa = 4.98AAHH53 pKa = 6.41KK54 pKa = 10.18AHH56 pKa = 7.35WDD58 pKa = 3.41QVVEE62 pKa = 5.05DD63 pKa = 4.84FTADD67 pKa = 3.34HH68 pKa = 7.16PEE70 pKa = 3.58ITVDD74 pKa = 3.8YY75 pKa = 10.82EE76 pKa = 3.71IFPWANRR83 pKa = 11.84DD84 pKa = 3.28EE85 pKa = 4.47ALQTAIAAKK94 pKa = 9.39TGPDD98 pKa = 3.73LVYY101 pKa = 10.71LIPDD105 pKa = 3.25QLAAYY110 pKa = 9.34QDD112 pKa = 4.33AIEE115 pKa = 5.13PIGPYY120 pKa = 10.5LSDD123 pKa = 3.4EE124 pKa = 4.4RR125 pKa = 11.84KK126 pKa = 9.92SDD128 pKa = 3.66LLDD131 pKa = 3.41NVMEE135 pKa = 4.42SVTLDD140 pKa = 3.69GEE142 pKa = 4.77LMGAPMLTSALPLLCDD158 pKa = 3.61GQVFEE163 pKa = 5.09AAGLTEE169 pKa = 5.18YY170 pKa = 10.65PEE172 pKa = 4.04TWDD175 pKa = 4.17DD176 pKa = 3.79VLEE179 pKa = 4.35IAPQLSEE186 pKa = 3.85QGLYY190 pKa = 9.12TISYY194 pKa = 8.51SAYY197 pKa = 9.81PEE199 pKa = 3.85MTLNQSFYY207 pKa = 10.61PLLWQAGGSIYY218 pKa = 10.71SEE220 pKa = 4.99DD221 pKa = 3.73GSSVGFNEE229 pKa = 4.21EE230 pKa = 4.11PGVEE234 pKa = 3.73ALSFLTEE241 pKa = 4.02LAEE244 pKa = 4.15QDD246 pKa = 3.91ALVPDD251 pKa = 4.71ALTTNVPMEE260 pKa = 3.97QTAIAQHH267 pKa = 6.11KK268 pKa = 7.38VACTWNHH275 pKa = 5.09SVAEE279 pKa = 4.2VQPFWDD285 pKa = 5.71DD286 pKa = 3.06IHH288 pKa = 8.27VVAPLKK294 pKa = 10.78DD295 pKa = 3.86KK296 pKa = 11.19EE297 pKa = 4.4SVAYY301 pKa = 8.31GTVGSLAMLTGAQDD315 pKa = 3.5KK316 pKa = 9.76EE317 pKa = 3.87AAAAFAEE324 pKa = 4.7YY325 pKa = 8.62ATGEE329 pKa = 4.37DD330 pKa = 3.72VVVPYY335 pKa = 8.77LTQAGFFSALKK346 pKa = 9.42STGEE350 pKa = 4.43LYY352 pKa = 10.94ADD354 pKa = 4.52DD355 pKa = 4.85PVLSAVEE362 pKa = 3.88ATIPSTTVGEE372 pKa = 4.58LNTSSRR378 pKa = 11.84EE379 pKa = 4.0LMGVLVPEE387 pKa = 4.43IQAALLGQKK396 pKa = 9.37SAQEE400 pKa = 4.17ALDD403 pKa = 3.76AAAAAAEE410 pKa = 4.06PLLAKK415 pKa = 10.48
MM1 pKa = 7.3RR2 pKa = 11.84TKK4 pKa = 10.43KK5 pKa = 10.7VLGITAGLAAALLVAGCSGGGGSGDD30 pKa = 3.48GDD32 pKa = 3.74GSQDD36 pKa = 3.26QHH38 pKa = 4.68VTLWLYY44 pKa = 10.22PILADD49 pKa = 3.74EE50 pKa = 4.98AAHH53 pKa = 6.41KK54 pKa = 10.18AHH56 pKa = 7.35WDD58 pKa = 3.41QVVEE62 pKa = 5.05DD63 pKa = 4.84FTADD67 pKa = 3.34HH68 pKa = 7.16PEE70 pKa = 3.58ITVDD74 pKa = 3.8YY75 pKa = 10.82EE76 pKa = 3.71IFPWANRR83 pKa = 11.84DD84 pKa = 3.28EE85 pKa = 4.47ALQTAIAAKK94 pKa = 9.39TGPDD98 pKa = 3.73LVYY101 pKa = 10.71LIPDD105 pKa = 3.25QLAAYY110 pKa = 9.34QDD112 pKa = 4.33AIEE115 pKa = 5.13PIGPYY120 pKa = 10.5LSDD123 pKa = 3.4EE124 pKa = 4.4RR125 pKa = 11.84KK126 pKa = 9.92SDD128 pKa = 3.66LLDD131 pKa = 3.41NVMEE135 pKa = 4.42SVTLDD140 pKa = 3.69GEE142 pKa = 4.77LMGAPMLTSALPLLCDD158 pKa = 3.61GQVFEE163 pKa = 5.09AAGLTEE169 pKa = 5.18YY170 pKa = 10.65PEE172 pKa = 4.04TWDD175 pKa = 4.17DD176 pKa = 3.79VLEE179 pKa = 4.35IAPQLSEE186 pKa = 3.85QGLYY190 pKa = 9.12TISYY194 pKa = 8.51SAYY197 pKa = 9.81PEE199 pKa = 3.85MTLNQSFYY207 pKa = 10.61PLLWQAGGSIYY218 pKa = 10.71SEE220 pKa = 4.99DD221 pKa = 3.73GSSVGFNEE229 pKa = 4.21EE230 pKa = 4.11PGVEE234 pKa = 3.73ALSFLTEE241 pKa = 4.02LAEE244 pKa = 4.15QDD246 pKa = 3.91ALVPDD251 pKa = 4.71ALTTNVPMEE260 pKa = 3.97QTAIAQHH267 pKa = 6.11KK268 pKa = 7.38VACTWNHH275 pKa = 5.09SVAEE279 pKa = 4.2VQPFWDD285 pKa = 5.71DD286 pKa = 3.06IHH288 pKa = 8.27VVAPLKK294 pKa = 10.78DD295 pKa = 3.86KK296 pKa = 11.19EE297 pKa = 4.4SVAYY301 pKa = 8.31GTVGSLAMLTGAQDD315 pKa = 3.5KK316 pKa = 9.76EE317 pKa = 3.87AAAAFAEE324 pKa = 4.7YY325 pKa = 8.62ATGEE329 pKa = 4.37DD330 pKa = 3.72VVVPYY335 pKa = 8.77LTQAGFFSALKK346 pKa = 9.42STGEE350 pKa = 4.43LYY352 pKa = 10.94ADD354 pKa = 4.52DD355 pKa = 4.85PVLSAVEE362 pKa = 3.88ATIPSTTVGEE372 pKa = 4.58LNTSSRR378 pKa = 11.84EE379 pKa = 4.0LMGVLVPEE387 pKa = 4.43IQAALLGQKK396 pKa = 9.37SAQEE400 pKa = 4.17ALDD403 pKa = 3.76AAAAAAEE410 pKa = 4.06PLLAKK415 pKa = 10.48
Molecular weight: 44.11 kDa
Isoelectric point according different methods:
Protein with the highest isoelectric point:
>tr|A0A1P8U606|A0A1P8U606_9MICO ATPase OS=Microbacterium aurum OX=36805 GN=BOH66_03925 PE=4 SV=1
MM1 pKa = 7.4GSVIKK6 pKa = 10.42KK7 pKa = 8.47RR8 pKa = 11.84RR9 pKa = 11.84KK10 pKa = 9.22RR11 pKa = 11.84MAKK14 pKa = 9.41KK15 pKa = 9.87KK16 pKa = 9.7HH17 pKa = 5.84RR18 pKa = 11.84KK19 pKa = 8.56LLRR22 pKa = 11.84KK23 pKa = 7.78TRR25 pKa = 11.84HH26 pKa = 3.65QRR28 pKa = 11.84RR29 pKa = 11.84NKK31 pKa = 9.78KK32 pKa = 9.85
MM1 pKa = 7.4GSVIKK6 pKa = 10.42KK7 pKa = 8.47RR8 pKa = 11.84RR9 pKa = 11.84KK10 pKa = 9.22RR11 pKa = 11.84MAKK14 pKa = 9.41KK15 pKa = 9.87KK16 pKa = 9.7HH17 pKa = 5.84RR18 pKa = 11.84KK19 pKa = 8.56LLRR22 pKa = 11.84KK23 pKa = 7.78TRR25 pKa = 11.84HH26 pKa = 3.65QRR28 pKa = 11.84RR29 pKa = 11.84NKK31 pKa = 9.78KK32 pKa = 9.85
Molecular weight: 4.08 kDa
Isoelectric point according different methods:
Peptides (in silico digests for buttom-up proteomics)
Below you can find in silico digests of the whole proteome with Trypsin, Chymotrypsin, Trypsin+LysC, LysN, ArgC proteases suitable for different mass spec machines.| Try ESI |
 |
|---|
| ChTry ESI |
 |
|---|
| ArgC ESI |
 |
|---|
| LysN ESI |
 |
|---|
| TryLysC ESI |
 |
|---|
| Try MALDI |
 |
|---|
| ChTry MALDI |
 |
|---|
| ArgC MALDI |
 |
|---|
| LysN MALDI |
 |
|---|
| TryLysC MALDI |
 |
|---|
| Try LTQ |
 |
|---|
| ChTry LTQ |
 |
|---|
| ArgC LTQ |
 |
|---|
| LysN LTQ |
 |
|---|
| TryLysC LTQ |
 |
|---|
| Try MSlow |
 |
|---|
| ChTry MSlow |
 |
|---|
| ArgC MSlow |
 |
|---|
| LysN MSlow |
 |
|---|
| TryLysC MSlow |
 |
|---|
| Try MShigh |
 |
|---|
| ChTry MShigh |
 |
|---|
| ArgC MShigh |
 |
|---|
| LysN MShigh |
 |
|---|
| TryLysC MShigh |
 |
|---|
General Statistics
Number of major isoforms |
Number of additional isoforms |
Number of all proteins |
Number of amino acids |
Min. Seq. Length |
Max. Seq. Length |
Avg. Seq. Length |
Avg. Mol. Weight |
|---|---|---|---|---|---|---|---|
0 |
966754 |
29 |
3126 |
316.6 |
33.85 |
Amino acid frequency
Ala |
Cys |
Asp |
Glu |
Phe |
Gly |
His |
Ile |
Lys |
Leu |
|---|---|---|---|---|---|---|---|---|---|
14.259 ± 0.077 | 0.527 ± 0.011 |
6.39 ± 0.04 | 5.478 ± 0.041 |
3.002 ± 0.029 | 8.768 ± 0.038 |
2.035 ± 0.023 | 4.466 ± 0.032 |
1.923 ± 0.035 | 10.004 ± 0.05 |
Met |
Asn |
Gln |
Pro |
Arg |
Ser |
Thr |
Val |
Trp |
Tyr |
|---|---|---|---|---|---|---|---|---|---|
1.739 ± 0.018 | 1.821 ± 0.022 |
5.409 ± 0.029 | 2.858 ± 0.024 |
7.591 ± 0.054 | 5.177 ± 0.03 |
6.134 ± 0.042 | 8.928 ± 0.041 |
1.514 ± 0.021 | 1.977 ± 0.023 |
Most of the basic statistics you can see at this page can be downloaded from this CSV file
Proteome-pI is available under Creative Commons Attribution-NoDerivs license, for more details see here
| Reference: Kozlowski LP. Proteome-pI 2.0: Proteome Isoelectric Point Database Update. Nucleic Acids Res. 2021, doi: 10.1093/nar/gkab944 | Contact: Lukasz P. Kozlowski |
