Salinibacillus xinjiangensis
Taxonomy: cellular organisms; Bacteria; Terrabacteria group; Firmicutes; Bacilli; Bacillales; Bacillaceae; Salinibacillus
Average proteome isoelectric point is 6.09
Get precalculated fractions of proteins
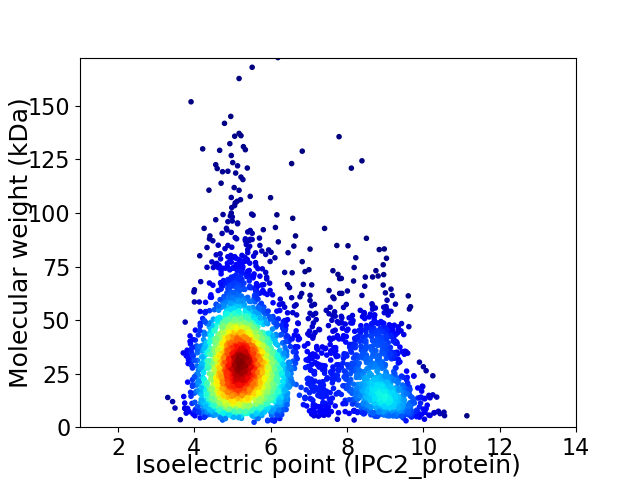
Virtual 2D-PAGE plot for 3701 proteins (isoelectric point calculated using IPC2_protein)
Get csv file with sequences according to given criteria:
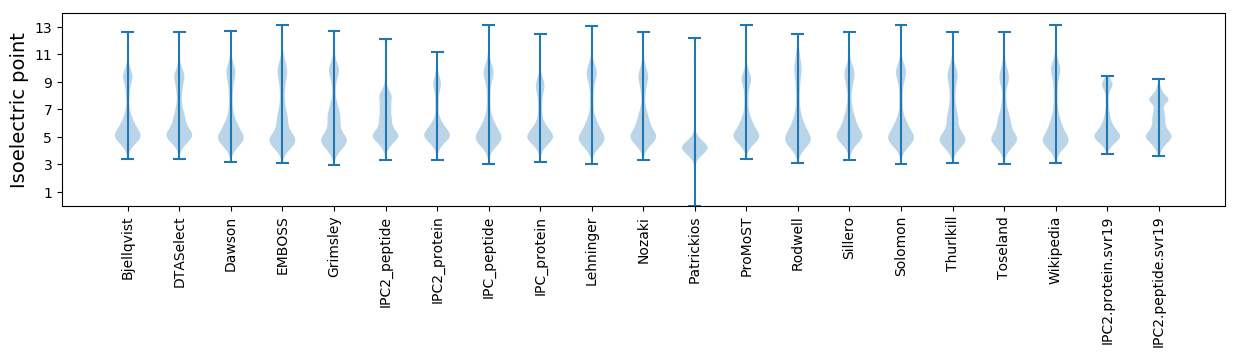
* You can choose from 21 different methods for calculating isoelectric point
Summary statistics related to proteome-wise predictions
Protein with the lowest isoelectric point:
>tr|A0A6G1X7Y2|A0A6G1X7Y2_9BACI Peptide ABC transporter substrate-binding protein OS=Salinibacillus xinjiangensis OX=1229268 GN=GH754_12215 PE=4 SV=1
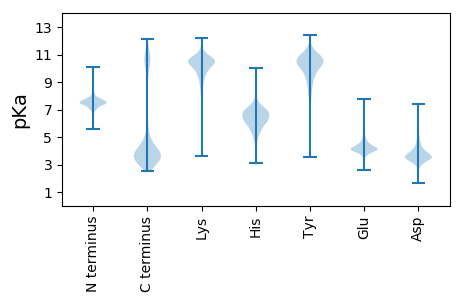
MM1 pKa = 7.51PAFVGAVKK9 pKa = 10.56VNSVGSSSIFHH20 pKa = 6.72IGDD23 pKa = 3.85VYY25 pKa = 11.61AMSPTSSAKK34 pKa = 9.11TFAGGGSFNTGDD46 pKa = 3.67GLSINVDD53 pKa = 3.08QSYY56 pKa = 8.68TYY58 pKa = 10.07VTDD61 pKa = 4.09SDD63 pKa = 4.44TFDD66 pKa = 3.15QTIVGNAA73 pKa = 3.12
MM1 pKa = 7.51PAFVGAVKK9 pKa = 10.56VNSVGSSSIFHH20 pKa = 6.72IGDD23 pKa = 3.85VYY25 pKa = 11.61AMSPTSSAKK34 pKa = 9.11TFAGGGSFNTGDD46 pKa = 3.67GLSINVDD53 pKa = 3.08QSYY56 pKa = 8.68TYY58 pKa = 10.07VTDD61 pKa = 4.09SDD63 pKa = 4.44TFDD66 pKa = 3.15QTIVGNAA73 pKa = 3.12
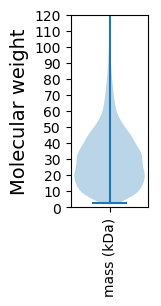
Molecular weight: 7.46 kDa
Isoelectric point according different methods:
Protein with the highest isoelectric point:
>tr|A0A6G1XAC1|A0A6G1XAC1_9BACI Membrane protein insertase YidC OS=Salinibacillus xinjiangensis OX=1229268 GN=yidC PE=3 SV=1
MM1 pKa = 7.36KK2 pKa = 9.43RR3 pKa = 11.84TYY5 pKa = 9.7QPKK8 pKa = 8.77KK9 pKa = 8.07RR10 pKa = 11.84KK11 pKa = 8.85RR12 pKa = 11.84SKK14 pKa = 9.05VHH16 pKa = 5.83GFRR19 pKa = 11.84SRR21 pKa = 11.84MSSKK25 pKa = 10.57NGRR28 pKa = 11.84KK29 pKa = 8.91VLARR33 pKa = 11.84RR34 pKa = 11.84RR35 pKa = 11.84RR36 pKa = 11.84KK37 pKa = 9.3GRR39 pKa = 11.84KK40 pKa = 8.62NLSAA44 pKa = 4.67
MM1 pKa = 7.36KK2 pKa = 9.43RR3 pKa = 11.84TYY5 pKa = 9.7QPKK8 pKa = 8.77KK9 pKa = 8.07RR10 pKa = 11.84KK11 pKa = 8.85RR12 pKa = 11.84SKK14 pKa = 9.05VHH16 pKa = 5.83GFRR19 pKa = 11.84SRR21 pKa = 11.84MSSKK25 pKa = 10.57NGRR28 pKa = 11.84KK29 pKa = 8.91VLARR33 pKa = 11.84RR34 pKa = 11.84RR35 pKa = 11.84RR36 pKa = 11.84KK37 pKa = 9.3GRR39 pKa = 11.84KK40 pKa = 8.62NLSAA44 pKa = 4.67
Molecular weight: 5.33 kDa
Isoelectric point according different methods:
Peptides (in silico digests for buttom-up proteomics)
Below you can find in silico digests of the whole proteome with Trypsin, Chymotrypsin, Trypsin+LysC, LysN, ArgC proteases suitable for different mass spec machines.| Try ESI |
 |
|---|
| ChTry ESI |
|
|---|
| ArgC ESI |
|
|---|
| LysN ESI |
|
|---|
| TryLysC ESI |
|
|---|
| Try MALDI |
|
|---|
| ChTry MALDI |
|
|---|
| ArgC MALDI |
|
|---|
| LysN MALDI |
|
|---|
| TryLysC MALDI |
|
|---|
| Try LTQ |
|
|---|
| ChTry LTQ |
|
|---|
| ArgC LTQ |
|
|---|
| LysN LTQ |
|
|---|
| TryLysC LTQ |
|
|---|
| Try MSlow |
|
|---|
| ChTry MSlow |
|
|---|
| ArgC MSlow |
|
|---|
| LysN MSlow |
|
|---|
| TryLysC MSlow |
|
|---|
| Try MShigh |
|
|---|
| ChTry MShigh |
|
|---|
| ArgC MShigh |
|
|---|
| LysN MShigh |
|
|---|
| TryLysC MShigh |
|
|---|
General Statistics
Number of major isoforms |
Number of additional isoforms |
Number of all proteins |
Number of amino acids |
Min. Seq. Length |
Max. Seq. Length |
Avg. Seq. Length |
Avg. Mol. Weight |
|---|---|---|---|---|---|---|---|
0 |
1049479 |
19 |
1509 |
283.6 |
31.95 |
Amino acid frequency
Ala |
Cys |
Asp |
Glu |
Phe |
Gly |
His |
Ile |
Lys |
Leu |
|---|---|---|---|---|---|---|---|---|---|
6.431 ± 0.042 | 0.626 ± 0.012 |
5.38 ± 0.033 | 7.872 ± 0.054 |
4.552 ± 0.038 | 6.843 ± 0.045 |
2.186 ± 0.02 | 7.737 ± 0.041 |
6.858 ± 0.043 | 9.543 ± 0.055 |
Met |
Asn |
Gln |
Pro |
Arg |
Ser |
Thr |
Val |
Trp |
Tyr |
|---|---|---|---|---|---|---|---|---|---|
2.807 ± 0.019 | 4.528 ± 0.034 |
3.605 ± 0.026 | 4.152 ± 0.032 |
3.896 ± 0.03 | 5.97 ± 0.028 |
5.358 ± 0.028 | 7.112 ± 0.033 |
1.023 ± 0.016 | 3.522 ± 0.027 |
Most of the basic statistics you can see at this page can be downloaded from this CSV file
See this proteome in:

Proteome-pI is available under Creative Commons Attribution-NoDerivs license, for more details see here
| Reference: Kozlowski LP. Proteome-pI 2.0: Proteome Isoelectric Point Database Update. Nucleic Acids Res. 2021, doi: 10.1093/nar/gkab944 | Contact: Lukasz P. Kozlowski |