Dechloromonas denitrificans
Taxonomy: cellular organisms; Bacteria; Proteobacteria; Betaproteobacteria; Rhodocyclales; Azonexaceae; Dechloromonas
Average proteome isoelectric point is 6.56
Get precalculated fractions of proteins
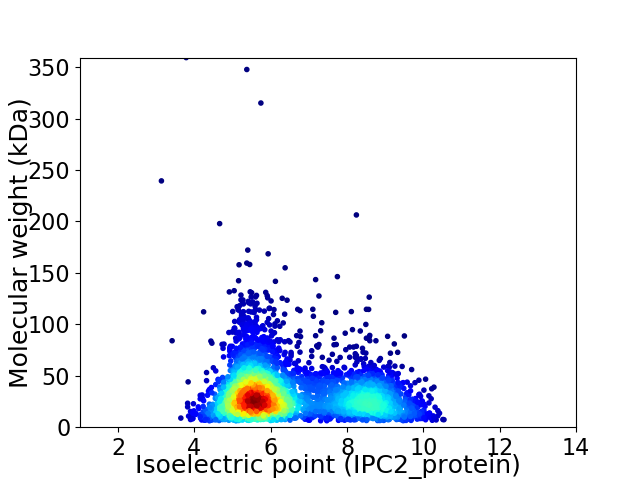
Virtual 2D-PAGE plot for 3886 proteins (isoelectric point calculated using IPC2_protein)
Get csv file with sequences according to given criteria:
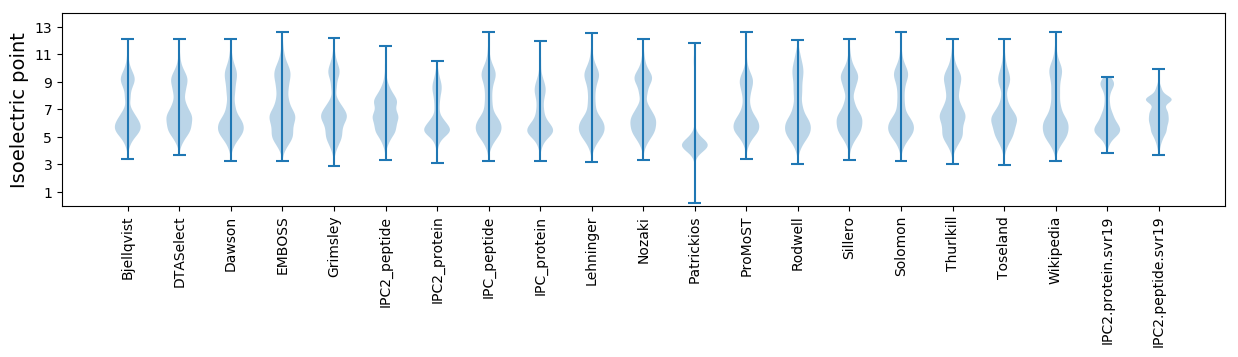
* You can choose from 21 different methods for calculating isoelectric point
Summary statistics related to proteome-wise predictions
Protein with the lowest isoelectric point:
>tr|A0A133XM53|A0A133XM53_9RHOO OmpA-like domain-containing protein OS=Dechloromonas denitrificans OX=281362 GN=AT959_02895 PE=4 SV=1
MM1 pKa = 7.2NAVTEE6 pKa = 4.36MTSPLLFTDD15 pKa = 3.68NAANKK20 pKa = 9.13VKK22 pKa = 10.39EE23 pKa = 4.28LIEE26 pKa = 4.21EE27 pKa = 4.26EE28 pKa = 4.49GNPGLKK34 pKa = 10.26LRR36 pKa = 11.84VFVTGGGCSGFQYY49 pKa = 10.93GFTFDD54 pKa = 4.28EE55 pKa = 4.93EE56 pKa = 4.59VNEE59 pKa = 5.46DD60 pKa = 3.7DD61 pKa = 3.86TTMEE65 pKa = 4.34KK66 pKa = 10.84NGVTLLIDD74 pKa = 3.7PMSYY78 pKa = 10.39QYY80 pKa = 11.8LLGAEE85 pKa = 4.0IDD87 pKa = 3.8YY88 pKa = 11.47SEE90 pKa = 4.55GLEE93 pKa = 4.01GSQFVIRR100 pKa = 11.84NPNATSTCGCGSSFSAA116 pKa = 4.79
MM1 pKa = 7.2NAVTEE6 pKa = 4.36MTSPLLFTDD15 pKa = 3.68NAANKK20 pKa = 9.13VKK22 pKa = 10.39EE23 pKa = 4.28LIEE26 pKa = 4.21EE27 pKa = 4.26EE28 pKa = 4.49GNPGLKK34 pKa = 10.26LRR36 pKa = 11.84VFVTGGGCSGFQYY49 pKa = 10.93GFTFDD54 pKa = 4.28EE55 pKa = 4.93EE56 pKa = 4.59VNEE59 pKa = 5.46DD60 pKa = 3.7DD61 pKa = 3.86TTMEE65 pKa = 4.34KK66 pKa = 10.84NGVTLLIDD74 pKa = 3.7PMSYY78 pKa = 10.39QYY80 pKa = 11.8LLGAEE85 pKa = 4.0IDD87 pKa = 3.8YY88 pKa = 11.47SEE90 pKa = 4.55GLEE93 pKa = 4.01GSQFVIRR100 pKa = 11.84NPNATSTCGCGSSFSAA116 pKa = 4.79
Molecular weight: 12.53 kDa
Isoelectric point according different methods:
Protein with the highest isoelectric point:
>tr|A0A133XG86|A0A133XG86_9RHOO ABC transporter ATP-binding protein OS=Dechloromonas denitrificans OX=281362 GN=AT959_17580 PE=4 SV=1
MM1 pKa = 6.98STLVLPPAIRR11 pKa = 11.84SLAHH15 pKa = 6.26RR16 pKa = 11.84NFRR19 pKa = 11.84LYY21 pKa = 10.87FLGQAISILGSWIQQVALSWLVYY44 pKa = 10.43RR45 pKa = 11.84LTGSAALLGVTAFCALIPQLLVGPLAGAWIDD76 pKa = 3.69KK77 pKa = 9.32QDD79 pKa = 3.3KK80 pKa = 9.78RR81 pKa = 11.84KK82 pKa = 9.0WLIGIQSLLAAQAFLLAGLTWSGLIGTGFIILMSLTLGILNSFDD126 pKa = 3.42TPLRR130 pKa = 11.84QSLIGSFVGSRR141 pKa = 11.84EE142 pKa = 4.05DD143 pKa = 4.23LPNALALNAMLFNAGRR159 pKa = 11.84FVGPPIAGLLVGLTSEE175 pKa = 4.53AACFAINGFSFLALIGGLRR194 pKa = 11.84FIQMTASPRR203 pKa = 11.84ASGSVGQVFKK213 pKa = 11.28EE214 pKa = 4.23GVLYY218 pKa = 10.35AWQTWTVRR226 pKa = 11.84MLIITLIGLNLTASAYY242 pKa = 10.35AVLLPVFARR251 pKa = 11.84DD252 pKa = 3.56VFAGDD257 pKa = 3.33ATTLGWLWGAAGCGAFASTIFLATRR282 pKa = 11.84KK283 pKa = 7.56TIPGLITAVVAGVAISAVALLLFGATTRR311 pKa = 11.84LPLALTAMVALGFGISVCNVGINMILQSAAPDD343 pKa = 3.48QLRR346 pKa = 11.84GRR348 pKa = 11.84IVSFFTSARR357 pKa = 11.84FGFDD361 pKa = 2.95ALGGLIAGFVAGALGAGQTLLFEE384 pKa = 4.71GVALFLFVIFLLTRR398 pKa = 11.84RR399 pKa = 11.84HH400 pKa = 6.33RR401 pKa = 11.84LTAQVSAAHH410 pKa = 6.48GEE412 pKa = 4.36SSNGHH417 pKa = 5.54
MM1 pKa = 6.98STLVLPPAIRR11 pKa = 11.84SLAHH15 pKa = 6.26RR16 pKa = 11.84NFRR19 pKa = 11.84LYY21 pKa = 10.87FLGQAISILGSWIQQVALSWLVYY44 pKa = 10.43RR45 pKa = 11.84LTGSAALLGVTAFCALIPQLLVGPLAGAWIDD76 pKa = 3.69KK77 pKa = 9.32QDD79 pKa = 3.3KK80 pKa = 9.78RR81 pKa = 11.84KK82 pKa = 9.0WLIGIQSLLAAQAFLLAGLTWSGLIGTGFIILMSLTLGILNSFDD126 pKa = 3.42TPLRR130 pKa = 11.84QSLIGSFVGSRR141 pKa = 11.84EE142 pKa = 4.05DD143 pKa = 4.23LPNALALNAMLFNAGRR159 pKa = 11.84FVGPPIAGLLVGLTSEE175 pKa = 4.53AACFAINGFSFLALIGGLRR194 pKa = 11.84FIQMTASPRR203 pKa = 11.84ASGSVGQVFKK213 pKa = 11.28EE214 pKa = 4.23GVLYY218 pKa = 10.35AWQTWTVRR226 pKa = 11.84MLIITLIGLNLTASAYY242 pKa = 10.35AVLLPVFARR251 pKa = 11.84DD252 pKa = 3.56VFAGDD257 pKa = 3.33ATTLGWLWGAAGCGAFASTIFLATRR282 pKa = 11.84KK283 pKa = 7.56TIPGLITAVVAGVAISAVALLLFGATTRR311 pKa = 11.84LPLALTAMVALGFGISVCNVGINMILQSAAPDD343 pKa = 3.48QLRR346 pKa = 11.84GRR348 pKa = 11.84IVSFFTSARR357 pKa = 11.84FGFDD361 pKa = 2.95ALGGLIAGFVAGALGAGQTLLFEE384 pKa = 4.71GVALFLFVIFLLTRR398 pKa = 11.84RR399 pKa = 11.84HH400 pKa = 6.33RR401 pKa = 11.84LTAQVSAAHH410 pKa = 6.48GEE412 pKa = 4.36SSNGHH417 pKa = 5.54
Molecular weight: 43.79 kDa
Isoelectric point according different methods:
Peptides (in silico digests for buttom-up proteomics)
Below you can find in silico digests of the whole proteome with Trypsin, Chymotrypsin, Trypsin+LysC, LysN, ArgC proteases suitable for different mass spec machines.| Try ESI |
 |
|---|
| ChTry ESI |
|
|---|
| ArgC ESI |
|
|---|
| LysN ESI |
|
|---|
| TryLysC ESI |
|
|---|
| Try MALDI |
|
|---|
| ChTry MALDI |
|
|---|
| ArgC MALDI |
|
|---|
| LysN MALDI |
|
|---|
| TryLysC MALDI |
|
|---|
| Try LTQ |
|
|---|
| ChTry LTQ |
|
|---|
| ArgC LTQ |
|
|---|
| LysN LTQ |
|
|---|
| TryLysC LTQ |
|
|---|
| Try MSlow |
|
|---|
| ChTry MSlow |
|
|---|
| ArgC MSlow |
|
|---|
| LysN MSlow |
|
|---|
| TryLysC MSlow |
|
|---|
| Try MShigh |
|
|---|
| ChTry MShigh |
|
|---|
| ArgC MShigh |
|
|---|
| LysN MShigh |
|
|---|
| TryLysC MShigh |
|
|---|
General Statistics
Number of major isoforms |
Number of additional isoforms |
Number of all proteins |
Number of amino acids |
Min. Seq. Length |
Max. Seq. Length |
Avg. Seq. Length |
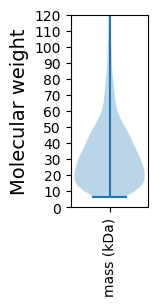
Avg. Mol. Weight |
|---|---|---|---|---|---|---|---|
0 |
1254878 |
55 |
3437 |
322.9 |
35.27 |
Amino acid frequency
Ala |
Cys |
Asp |
Glu |
Phe |
Gly |
His |
Ile |
Lys |
Leu |
|---|---|---|---|---|---|---|---|---|---|
11.948 ± 0.06 | 0.993 ± 0.014 |
5.237 ± 0.034 | 6.001 ± 0.038 |
3.734 ± 0.027 | 8.073 ± 0.043 |
2.193 ± 0.018 | 5.161 ± 0.029 |
3.9 ± 0.035 | 11.229 ± 0.049 |
Met |
Asn |
Gln |
Pro |
Arg |
Ser |
Thr |
Val |
Trp |
Tyr |
|---|---|---|---|---|---|---|---|---|---|
2.399 ± 0.02 | 2.994 ± 0.029 |
4.85 ± 0.03 | 3.919 ± 0.026 |
6.428 ± 0.043 | 5.437 ± 0.032 |
4.771 ± 0.033 | 7.035 ± 0.033 |
1.353 ± 0.018 | 2.346 ± 0.02 |
Most of the basic statistics you can see at this page can be downloaded from this CSV file
See this proteome in:

Proteome-pI is available under Creative Commons Attribution-NoDerivs license, for more details see here
| Reference: Kozlowski LP. Proteome-pI 2.0: Proteome Isoelectric Point Database Update. Nucleic Acids Res. 2021, doi: 10.1093/nar/gkab944 | Contact: Lukasz P. Kozlowski |