Tenacibaculum soleae
Taxonomy: cellular organisms; Bacteria; FCB group; Bacteroidetes/Chlorobi group; Bacteroidetes; Flavobacteriia; Flavobacteriales; Flavobacteriaceae; Tenacibaculum
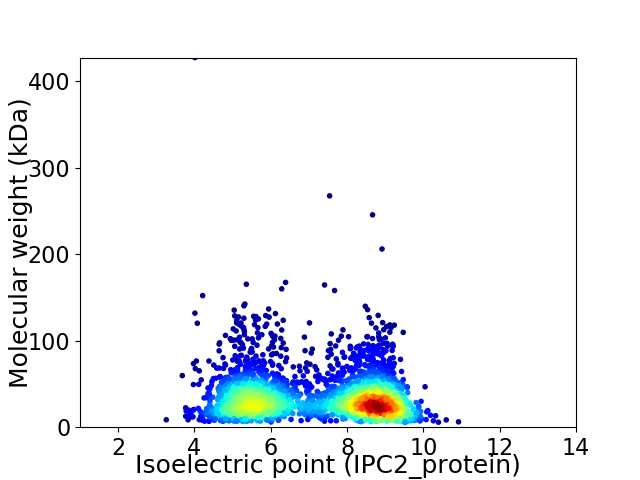
Average proteome isoelectric point is 7.17
Get precalculated fractions of proteins

Virtual 2D-PAGE plot for 2722 proteins (isoelectric point calculated using IPC2_protein)
Get csv file with sequences according to given criteria:
* You can choose from 21 different methods for calculating isoelectric point
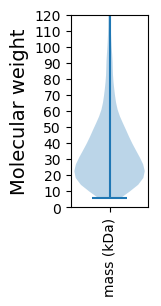
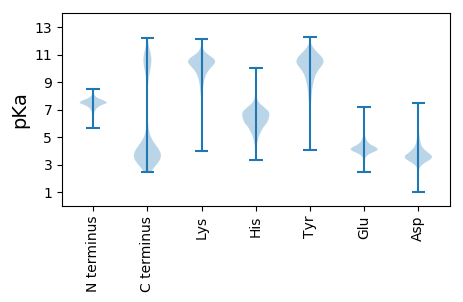
Summary statistics related to proteome-wise predictions


Protein with the lowest isoelectric point:
>tr|A0A1B9XZA5|A0A1B9XZA5_9FLAO Two-component system response regulator OS=Tenacibaculum soleae OX=447689 GN=BA195_08175 PE=4 SV=1
MM1 pKa = 7.4KK2 pKa = 10.2KK3 pKa = 10.62VNLFMIALALAFTTQKK19 pKa = 9.52TVAQDD24 pKa = 3.72NNDD27 pKa = 3.63TNQATHH33 pKa = 6.05QLDD36 pKa = 3.86VNVPEE41 pKa = 5.13LALIDD46 pKa = 3.19IWDD49 pKa = 4.01ANEE52 pKa = 3.81GAEE55 pKa = 4.33AATILMDD62 pKa = 3.7MANVTLVGTNAEE74 pKa = 4.01AGLYY78 pKa = 10.07AFQDD82 pKa = 2.99MDD84 pKa = 3.86YY85 pKa = 11.38QNLYY89 pKa = 10.86LNYY92 pKa = 9.76TSVTGAGGSGFDD104 pKa = 3.33VTRR107 pKa = 11.84QIDD110 pKa = 3.62VQFEE114 pKa = 4.09AGSTFPGSLDD124 pKa = 3.88LRR126 pKa = 11.84ITPEE130 pKa = 3.89APLVVVNGGTVDD142 pKa = 3.2SAGTVTAGGVALGATTPIGTDD163 pKa = 3.09VLLVNSIEE171 pKa = 4.26SVYY174 pKa = 10.89TGDD177 pKa = 3.21EE178 pKa = 4.19TQGVKK183 pKa = 10.06LAYY186 pKa = 9.3TLEE189 pKa = 4.26QNGNFAGYY197 pKa = 9.32QAGSYY202 pKa = 9.82SAVIRR207 pKa = 11.84YY208 pKa = 6.96TLSDD212 pKa = 3.25NN213 pKa = 3.82
MM1 pKa = 7.4KK2 pKa = 10.2KK3 pKa = 10.62VNLFMIALALAFTTQKK19 pKa = 9.52TVAQDD24 pKa = 3.72NNDD27 pKa = 3.63TNQATHH33 pKa = 6.05QLDD36 pKa = 3.86VNVPEE41 pKa = 5.13LALIDD46 pKa = 3.19IWDD49 pKa = 4.01ANEE52 pKa = 3.81GAEE55 pKa = 4.33AATILMDD62 pKa = 3.7MANVTLVGTNAEE74 pKa = 4.01AGLYY78 pKa = 10.07AFQDD82 pKa = 2.99MDD84 pKa = 3.86YY85 pKa = 11.38QNLYY89 pKa = 10.86LNYY92 pKa = 9.76TSVTGAGGSGFDD104 pKa = 3.33VTRR107 pKa = 11.84QIDD110 pKa = 3.62VQFEE114 pKa = 4.09AGSTFPGSLDD124 pKa = 3.88LRR126 pKa = 11.84ITPEE130 pKa = 3.89APLVVVNGGTVDD142 pKa = 3.2SAGTVTAGGVALGATTPIGTDD163 pKa = 3.09VLLVNSIEE171 pKa = 4.26SVYY174 pKa = 10.89TGDD177 pKa = 3.21EE178 pKa = 4.19TQGVKK183 pKa = 10.06LAYY186 pKa = 9.3TLEE189 pKa = 4.26QNGNFAGYY197 pKa = 9.32QAGSYY202 pKa = 9.82SAVIRR207 pKa = 11.84YY208 pKa = 6.96TLSDD212 pKa = 3.25NN213 pKa = 3.82
Molecular weight: 22.41 kDa
Isoelectric point according different methods:
Protein with the highest isoelectric point:
>tr|A0A1B9XWN2|A0A1B9XWN2_9FLAO Mechanosensitive ion channel protein MscS OS=Tenacibaculum soleae OX=447689 GN=BA195_13110 PE=3 SV=1
MM1 pKa = 8.03PKK3 pKa = 8.97RR4 pKa = 11.84TYY6 pKa = 10.33QPSKK10 pKa = 9.01RR11 pKa = 11.84KK12 pKa = 9.47RR13 pKa = 11.84RR14 pKa = 11.84NKK16 pKa = 9.49HH17 pKa = 3.94GFRR20 pKa = 11.84EE21 pKa = 4.27RR22 pKa = 11.84MASANGRR29 pKa = 11.84KK30 pKa = 9.04VLARR34 pKa = 11.84RR35 pKa = 11.84RR36 pKa = 11.84AKK38 pKa = 9.8GRR40 pKa = 11.84KK41 pKa = 8.71SISVSSAPRR50 pKa = 11.84PKK52 pKa = 10.38KK53 pKa = 10.5
MM1 pKa = 8.03PKK3 pKa = 8.97RR4 pKa = 11.84TYY6 pKa = 10.33QPSKK10 pKa = 9.01RR11 pKa = 11.84KK12 pKa = 9.47RR13 pKa = 11.84RR14 pKa = 11.84NKK16 pKa = 9.49HH17 pKa = 3.94GFRR20 pKa = 11.84EE21 pKa = 4.27RR22 pKa = 11.84MASANGRR29 pKa = 11.84KK30 pKa = 9.04VLARR34 pKa = 11.84RR35 pKa = 11.84RR36 pKa = 11.84AKK38 pKa = 9.8GRR40 pKa = 11.84KK41 pKa = 8.71SISVSSAPRR50 pKa = 11.84PKK52 pKa = 10.38KK53 pKa = 10.5
Molecular weight: 6.2 kDa
Isoelectric point according different methods:
Peptides (in silico digests for buttom-up proteomics)
Below you can find in silico digests of the whole proteome with Trypsin, Chymotrypsin, Trypsin+LysC, LysN, ArgC proteases suitable for different mass spec machines.| Try ESI |
 |
|---|
| ChTry ESI |
 |
|---|
| ArgC ESI |
 |
|---|
| LysN ESI |
 |
|---|
| TryLysC ESI |
 |
|---|
| Try MALDI |
 |
|---|
| ChTry MALDI |
 |
|---|
| ArgC MALDI |
 |
|---|
| LysN MALDI |
 |
|---|
| TryLysC MALDI |
 |
|---|
| Try LTQ |
 |
|---|
| ChTry LTQ |
 |
|---|
| ArgC LTQ |
 |
|---|
| LysN LTQ |
 |
|---|
| TryLysC LTQ |
 |
|---|
| Try MSlow |
 |
|---|
| ChTry MSlow |
 |
|---|
| ArgC MSlow |
 |
|---|
| LysN MSlow |
 |
|---|
| TryLysC MSlow |
 |
|---|
| Try MShigh |
 |
|---|
| ChTry MShigh |
 |
|---|
| ArgC MShigh |
 |
|---|
| LysN MShigh |
 |
|---|
| TryLysC MShigh |
 |
|---|
General Statistics
Number of major isoforms |
Number of additional isoforms |
Number of all proteins |
Number of amino acids |
Min. Seq. Length |
Max. Seq. Length |
Avg. Seq. Length |
Avg. Mol. Weight |
|---|---|---|---|---|---|---|---|
0 |
891548 |
50 |
3923 |
327.5 |
37.08 |
Amino acid frequency
Ala |
Cys |
Asp |
Glu |
Phe |
Gly |
His |
Ile |
Lys |
Leu |
|---|---|---|---|---|---|---|---|---|---|
6.066 ± 0.044 | 0.697 ± 0.013 |
5.186 ± 0.031 | 6.389 ± 0.048 |
5.335 ± 0.036 | 6.003 ± 0.046 |
1.699 ± 0.02 | 8.471 ± 0.048 |
9.278 ± 0.058 | 9.184 ± 0.049 |
Met |
Asn |
Gln |
Pro |
Arg |
Ser |
Thr |
Val |
Trp |
Tyr |
|---|---|---|---|---|---|---|---|---|---|
2.062 ± 0.028 | 6.841 ± 0.057 |
3.036 ± 0.025 | 3.298 ± 0.027 |
3.09 ± 0.029 | 6.256 ± 0.043 |
6.017 ± 0.05 | 6.156 ± 0.039 |
0.956 ± 0.019 | 3.98 ± 0.033 |
Most of the basic statistics you can see at this page can be downloaded from this CSV file
Proteome-pI is available under Creative Commons Attribution-NoDerivs license, for more details see here
| Reference: Kozlowski LP. Proteome-pI 2.0: Proteome Isoelectric Point Database Update. Nucleic Acids Res. 2021, doi: 10.1093/nar/gkab944 | Contact: Lukasz P. Kozlowski |
