Microbacterium ginsengiterrae
Taxonomy: cellular organisms; Bacteria; Terrabacteria group; Actinobacteria; Actinomycetia; Micrococcales; Microbacteriaceae; Microbacterium
Average proteome isoelectric point is 5.92
Get precalculated fractions of proteins

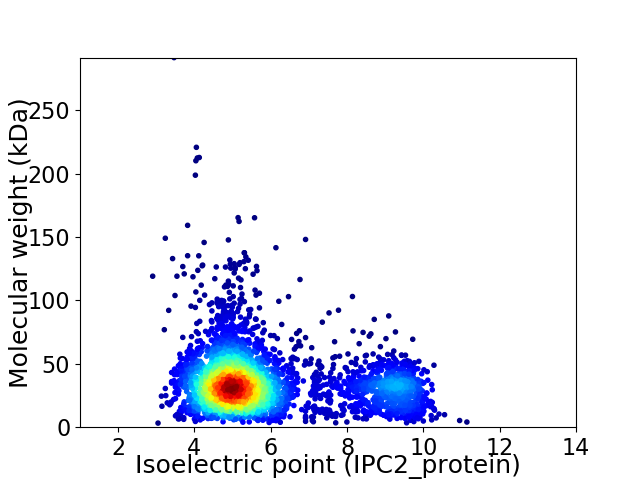
Virtual 2D-PAGE plot for 3754 proteins (isoelectric point calculated using IPC2_protein)
Get csv file with sequences according to given criteria:
* You can choose from 21 different methods for calculating isoelectric point
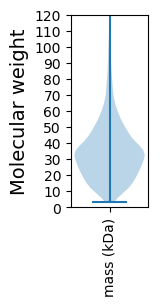
Summary statistics related to proteome-wise predictions


Protein with the lowest isoelectric point:
>tr|A0A419XZV6|A0A419XZV6_9MICO Putative repeat protein (TIGR03943 family) OS=Microbacterium ginsengiterrae OX=546115 GN=C7323_0272 PE=4 SV=1
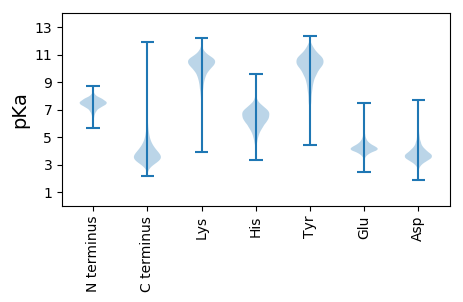
MM1 pKa = 7.97RR2 pKa = 11.84LPALRR7 pKa = 11.84LTGAAAVVLTTAAALVGCAPAPTAPEE33 pKa = 3.78LSGDD37 pKa = 4.09VFVHH41 pKa = 6.57DD42 pKa = 3.89PAYY45 pKa = 10.54AVTDD49 pKa = 4.04DD50 pKa = 3.77GSFVYY55 pKa = 9.45STGNGQIADD64 pKa = 3.73GNIQIRR70 pKa = 11.84RR71 pKa = 11.84SDD73 pKa = 4.59DD74 pKa = 3.58GADD77 pKa = 2.9WEE79 pKa = 4.72YY80 pKa = 11.48AGEE83 pKa = 4.23VWDD86 pKa = 5.45TKK88 pKa = 10.28PAWLGEE94 pKa = 4.06AVPGVDD100 pKa = 4.29NLWAPEE106 pKa = 4.15LYY108 pKa = 10.37EE109 pKa = 6.22HH110 pKa = 7.81DD111 pKa = 4.15GTWYY115 pKa = 10.61LYY117 pKa = 10.83YY118 pKa = 10.42SASTFGSNVSVIALATNEE136 pKa = 4.4TLDD139 pKa = 3.94PADD142 pKa = 4.59PAFEE146 pKa = 4.28WVDD149 pKa = 3.51QGPVIASEE157 pKa = 4.22STDD160 pKa = 3.81FNAIDD165 pKa = 3.72PGIVEE170 pKa = 4.89DD171 pKa = 5.29ADD173 pKa = 3.85GEE175 pKa = 4.12PWMAFGSFSSGLQIVPLQWPSGLRR199 pKa = 11.84ADD201 pKa = 3.85EE202 pKa = 4.69SEE204 pKa = 5.15PITIADD210 pKa = 3.53RR211 pKa = 11.84GLRR214 pKa = 11.84EE215 pKa = 3.99NAIEE219 pKa = 4.03APYY222 pKa = 10.12IVPHH226 pKa = 7.13DD227 pKa = 3.5GAFYY231 pKa = 10.88LFASRR236 pKa = 11.84GFCCRR241 pKa = 11.84GVDD244 pKa = 3.46STYY247 pKa = 10.7EE248 pKa = 4.12IIVGRR253 pKa = 11.84ADD255 pKa = 3.72SVTGPYY261 pKa = 10.4LDD263 pKa = 5.24ADD265 pKa = 4.27DD266 pKa = 5.22GALLEE271 pKa = 5.19DD272 pKa = 4.42GGTVVLTSEE281 pKa = 5.0GSRR284 pKa = 11.84VGPGGQSVSGDD295 pKa = 3.05VLAFHH300 pKa = 7.5FYY302 pKa = 10.89DD303 pKa = 4.61ADD305 pKa = 3.95ADD307 pKa = 4.62GIPTLGLQPIVWRR320 pKa = 11.84DD321 pKa = 3.14GWPTVVEE328 pKa = 4.27
MM1 pKa = 7.97RR2 pKa = 11.84LPALRR7 pKa = 11.84LTGAAAVVLTTAAALVGCAPAPTAPEE33 pKa = 3.78LSGDD37 pKa = 4.09VFVHH41 pKa = 6.57DD42 pKa = 3.89PAYY45 pKa = 10.54AVTDD49 pKa = 4.04DD50 pKa = 3.77GSFVYY55 pKa = 9.45STGNGQIADD64 pKa = 3.73GNIQIRR70 pKa = 11.84RR71 pKa = 11.84SDD73 pKa = 4.59DD74 pKa = 3.58GADD77 pKa = 2.9WEE79 pKa = 4.72YY80 pKa = 11.48AGEE83 pKa = 4.23VWDD86 pKa = 5.45TKK88 pKa = 10.28PAWLGEE94 pKa = 4.06AVPGVDD100 pKa = 4.29NLWAPEE106 pKa = 4.15LYY108 pKa = 10.37EE109 pKa = 6.22HH110 pKa = 7.81DD111 pKa = 4.15GTWYY115 pKa = 10.61LYY117 pKa = 10.83YY118 pKa = 10.42SASTFGSNVSVIALATNEE136 pKa = 4.4TLDD139 pKa = 3.94PADD142 pKa = 4.59PAFEE146 pKa = 4.28WVDD149 pKa = 3.51QGPVIASEE157 pKa = 4.22STDD160 pKa = 3.81FNAIDD165 pKa = 3.72PGIVEE170 pKa = 4.89DD171 pKa = 5.29ADD173 pKa = 3.85GEE175 pKa = 4.12PWMAFGSFSSGLQIVPLQWPSGLRR199 pKa = 11.84ADD201 pKa = 3.85EE202 pKa = 4.69SEE204 pKa = 5.15PITIADD210 pKa = 3.53RR211 pKa = 11.84GLRR214 pKa = 11.84EE215 pKa = 3.99NAIEE219 pKa = 4.03APYY222 pKa = 10.12IVPHH226 pKa = 7.13DD227 pKa = 3.5GAFYY231 pKa = 10.88LFASRR236 pKa = 11.84GFCCRR241 pKa = 11.84GVDD244 pKa = 3.46STYY247 pKa = 10.7EE248 pKa = 4.12IIVGRR253 pKa = 11.84ADD255 pKa = 3.72SVTGPYY261 pKa = 10.4LDD263 pKa = 5.24ADD265 pKa = 4.27DD266 pKa = 5.22GALLEE271 pKa = 5.19DD272 pKa = 4.42GGTVVLTSEE281 pKa = 5.0GSRR284 pKa = 11.84VGPGGQSVSGDD295 pKa = 3.05VLAFHH300 pKa = 7.5FYY302 pKa = 10.89DD303 pKa = 4.61ADD305 pKa = 3.95ADD307 pKa = 4.62GIPTLGLQPIVWRR320 pKa = 11.84DD321 pKa = 3.14GWPTVVEE328 pKa = 4.27
Molecular weight: 34.76 kDa
Isoelectric point according different methods:
Protein with the highest isoelectric point:
>tr|A0A419Y2I3|A0A419Y2I3_9MICO DNA-binding transcriptional MerR regulator OS=Microbacterium ginsengiterrae OX=546115 GN=C7323_1226 PE=4 SV=1
MM1 pKa = 7.4GSVIKK6 pKa = 10.42KK7 pKa = 8.47RR8 pKa = 11.84RR9 pKa = 11.84KK10 pKa = 9.22RR11 pKa = 11.84MAKK14 pKa = 9.41KK15 pKa = 9.87KK16 pKa = 9.7HH17 pKa = 5.84RR18 pKa = 11.84KK19 pKa = 8.56LLRR22 pKa = 11.84KK23 pKa = 7.78TRR25 pKa = 11.84HH26 pKa = 3.65QRR28 pKa = 11.84RR29 pKa = 11.84NKK31 pKa = 9.78KK32 pKa = 9.85
MM1 pKa = 7.4GSVIKK6 pKa = 10.42KK7 pKa = 8.47RR8 pKa = 11.84RR9 pKa = 11.84KK10 pKa = 9.22RR11 pKa = 11.84MAKK14 pKa = 9.41KK15 pKa = 9.87KK16 pKa = 9.7HH17 pKa = 5.84RR18 pKa = 11.84KK19 pKa = 8.56LLRR22 pKa = 11.84KK23 pKa = 7.78TRR25 pKa = 11.84HH26 pKa = 3.65QRR28 pKa = 11.84RR29 pKa = 11.84NKK31 pKa = 9.78KK32 pKa = 9.85
Molecular weight: 4.08 kDa
Isoelectric point according different methods:
Peptides (in silico digests for buttom-up proteomics)
Below you can find in silico digests of the whole proteome with Trypsin, Chymotrypsin, Trypsin+LysC, LysN, ArgC proteases suitable for different mass spec machines.| Try ESI |
 |
|---|
| ChTry ESI |
 |
|---|
| ArgC ESI |
 |
|---|
| LysN ESI |
 |
|---|
| TryLysC ESI |
 |
|---|
| Try MALDI |
 |
|---|
| ChTry MALDI |
 |
|---|
| ArgC MALDI |
 |
|---|
| LysN MALDI |
 |
|---|
| TryLysC MALDI |
 |
|---|
| Try LTQ |
 |
|---|
| ChTry LTQ |
 |
|---|
| ArgC LTQ |
 |
|---|
| LysN LTQ |
 |
|---|
| TryLysC LTQ |
 |
|---|
| Try MSlow |
 |
|---|
| ChTry MSlow |
 |
|---|
| ArgC MSlow |
 |
|---|
| LysN MSlow |
 |
|---|
| TryLysC MSlow |
 |
|---|
| Try MShigh |
 |
|---|
| ChTry MShigh |
 |
|---|
| ArgC MShigh |
 |
|---|
| LysN MShigh |
 |
|---|
| TryLysC MShigh |
 |
|---|
General Statistics
Number of major isoforms |
Number of additional isoforms |
Number of all proteins |
Number of amino acids |
Min. Seq. Length |
Max. Seq. Length |
Avg. Seq. Length |
Avg. Mol. Weight |
|---|---|---|---|---|---|---|---|
0 |
1274925 |
30 |
2824 |
339.6 |
36.36 |
Amino acid frequency
Ala |
Cys |
Asp |
Glu |
Phe |
Gly |
His |
Ile |
Lys |
Leu |
|---|---|---|---|---|---|---|---|---|---|
13.649 ± 0.057 | 0.467 ± 0.009 |
6.435 ± 0.037 | 5.755 ± 0.033 |
3.207 ± 0.024 | 8.834 ± 0.034 |
1.929 ± 0.017 | 4.933 ± 0.029 |
1.764 ± 0.028 | 10.074 ± 0.048 |
Met |
Asn |
Gln |
Pro |
Arg |
Ser |
Thr |
Val |
Trp |
Tyr |
|---|---|---|---|---|---|---|---|---|---|
1.795 ± 0.016 | 1.958 ± 0.021 |
5.262 ± 0.029 | 2.803 ± 0.02 |
7.153 ± 0.046 | 5.612 ± 0.028 |
6.038 ± 0.041 | 8.725 ± 0.035 |
1.591 ± 0.017 | 2.014 ± 0.021 |
Most of the basic statistics you can see at this page can be downloaded from this CSV file
Proteome-pI is available under Creative Commons Attribution-NoDerivs license, for more details see here
| Reference: Kozlowski LP. Proteome-pI 2.0: Proteome Isoelectric Point Database Update. Nucleic Acids Res. 2021, doi: 10.1093/nar/gkab944 | Contact: Lukasz P. Kozlowski |
