Thanatephorus cucumeris (strain AG1-IB / isolate 7/3/14) (Lettuce bottom rot fungus) (Rhizoctonia solani)
Taxonomy: cellular organisms; Eukaryota; Opisthokonta; Fungi; Dikarya; Basidiomycota; Agaricomycotina; Agaricomycetes; Agaricomycetes incertae sedis; Cantharellales; Ceratobasidiaceae; Rhizoctonia; Rhizoctonia solani; Rhizoctonia solani AG-1
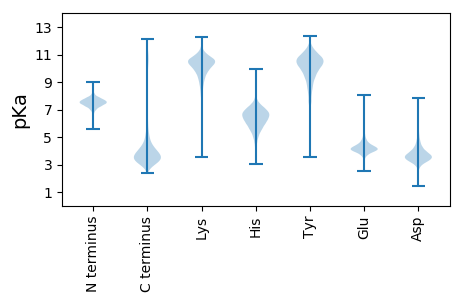
Average proteome isoelectric point is 6.7
Get precalculated fractions of proteins

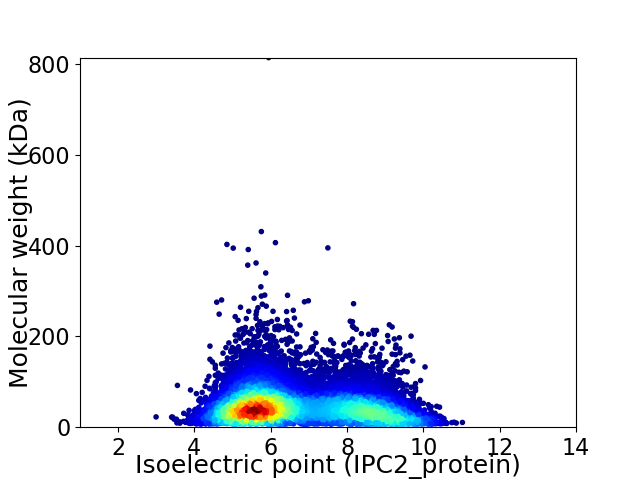
Virtual 2D-PAGE plot for 12613 proteins (isoelectric point calculated using IPC2_protein)
Get csv file with sequences according to given criteria:
* You can choose from 21 different methods for calculating isoelectric point
Summary statistics related to proteome-wise predictions


Protein with the lowest isoelectric point:
>tr|M5C8Q5|M5C8Q5_THACB CVNH domain-containing protein OS=Thanatephorus cucumeris (strain AG1-IB / isolate 7/3/14) OX=1108050 GN=BN14_09895 PE=4 SV=1
MM1 pKa = 7.3AHH3 pKa = 7.4DD4 pKa = 4.45IVGQGDD10 pKa = 3.47WKK12 pKa = 9.98YY13 pKa = 8.11WYY15 pKa = 10.76AMRR18 pKa = 11.84FVDD21 pKa = 4.08RR22 pKa = 11.84DD23 pKa = 2.92IMIRR27 pKa = 11.84YY28 pKa = 8.1HH29 pKa = 6.86GEE31 pKa = 4.04GVGHH35 pKa = 6.22HH36 pKa = 6.03TGSMKK41 pKa = 10.66AHH43 pKa = 7.26ADD45 pKa = 3.24IQEE48 pKa = 4.35DD49 pKa = 4.27VPNRR53 pKa = 11.84TEE55 pKa = 4.08EE56 pKa = 4.14YY57 pKa = 9.85PNQQEE62 pKa = 4.2IPFDD66 pKa = 3.54EE67 pKa = 4.92HH68 pKa = 9.01SEE70 pKa = 4.19NNDD73 pKa = 3.44DD74 pKa = 5.25EE75 pKa = 5.32NDD77 pKa = 3.49EE78 pKa = 4.54DD79 pKa = 4.71VVTEE83 pKa = 3.95AALATEE89 pKa = 4.64LVGDD93 pKa = 4.08EE94 pKa = 4.92PSDD97 pKa = 3.58EE98 pKa = 4.96DD99 pKa = 3.58EE100 pKa = 4.92GFLSGEE106 pKa = 4.77DD107 pKa = 3.79YY108 pKa = 11.3DD109 pKa = 3.92SGYY112 pKa = 10.99YY113 pKa = 9.51EE114 pKa = 4.52SKK116 pKa = 11.05EE117 pKa = 3.88DD118 pKa = 3.85MEE120 pKa = 4.55PVQYY124 pKa = 10.74EE125 pKa = 4.24YY126 pKa = 11.69
MM1 pKa = 7.3AHH3 pKa = 7.4DD4 pKa = 4.45IVGQGDD10 pKa = 3.47WKK12 pKa = 9.98YY13 pKa = 8.11WYY15 pKa = 10.76AMRR18 pKa = 11.84FVDD21 pKa = 4.08RR22 pKa = 11.84DD23 pKa = 2.92IMIRR27 pKa = 11.84YY28 pKa = 8.1HH29 pKa = 6.86GEE31 pKa = 4.04GVGHH35 pKa = 6.22HH36 pKa = 6.03TGSMKK41 pKa = 10.66AHH43 pKa = 7.26ADD45 pKa = 3.24IQEE48 pKa = 4.35DD49 pKa = 4.27VPNRR53 pKa = 11.84TEE55 pKa = 4.08EE56 pKa = 4.14YY57 pKa = 9.85PNQQEE62 pKa = 4.2IPFDD66 pKa = 3.54EE67 pKa = 4.92HH68 pKa = 9.01SEE70 pKa = 4.19NNDD73 pKa = 3.44DD74 pKa = 5.25EE75 pKa = 5.32NDD77 pKa = 3.49EE78 pKa = 4.54DD79 pKa = 4.71VVTEE83 pKa = 3.95AALATEE89 pKa = 4.64LVGDD93 pKa = 4.08EE94 pKa = 4.92PSDD97 pKa = 3.58EE98 pKa = 4.96DD99 pKa = 3.58EE100 pKa = 4.92GFLSGEE106 pKa = 4.77DD107 pKa = 3.79YY108 pKa = 11.3DD109 pKa = 3.92SGYY112 pKa = 10.99YY113 pKa = 9.51EE114 pKa = 4.52SKK116 pKa = 11.05EE117 pKa = 3.88DD118 pKa = 3.85MEE120 pKa = 4.55PVQYY124 pKa = 10.74EE125 pKa = 4.24YY126 pKa = 11.69
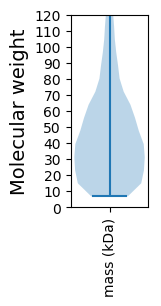
Molecular weight: 14.59 kDa
Isoelectric point according different methods:
Protein with the highest isoelectric point:
>tr|M5BND6|M5BND6_THACB ATG16 domain-containing protein OS=Thanatephorus cucumeris (strain AG1-IB / isolate 7/3/14) OX=1108050 GN=BN14_01788 PE=3 SV=1
MM1 pKa = 7.18FGSRR5 pKa = 11.84RR6 pKa = 11.84TRR8 pKa = 11.84ATHH11 pKa = 4.74TTHH14 pKa = 6.37TSTRR18 pKa = 11.84RR19 pKa = 11.84GGLGGMFRR27 pKa = 11.84RR28 pKa = 11.84KK29 pKa = 9.89NPNRR33 pKa = 11.84RR34 pKa = 11.84AGGYY38 pKa = 8.99KK39 pKa = 10.13AALHH43 pKa = 5.99NPNTTSSGRR52 pKa = 11.84QHH54 pKa = 7.22AKK56 pKa = 9.97RR57 pKa = 11.84GLRR60 pKa = 11.84SMGRR64 pKa = 11.84GSEE67 pKa = 3.92AHH69 pKa = 6.13VPLSVRR75 pKa = 11.84IKK77 pKa = 10.45HH78 pKa = 5.83FLHH81 pKa = 6.18IGGRR85 pKa = 11.84RR86 pKa = 11.84HH87 pKa = 4.2TTTRR91 pKa = 11.84RR92 pKa = 11.84YY93 pKa = 9.93
MM1 pKa = 7.18FGSRR5 pKa = 11.84RR6 pKa = 11.84TRR8 pKa = 11.84ATHH11 pKa = 4.74TTHH14 pKa = 6.37TSTRR18 pKa = 11.84RR19 pKa = 11.84GGLGGMFRR27 pKa = 11.84RR28 pKa = 11.84KK29 pKa = 9.89NPNRR33 pKa = 11.84RR34 pKa = 11.84AGGYY38 pKa = 8.99KK39 pKa = 10.13AALHH43 pKa = 5.99NPNTTSSGRR52 pKa = 11.84QHH54 pKa = 7.22AKK56 pKa = 9.97RR57 pKa = 11.84GLRR60 pKa = 11.84SMGRR64 pKa = 11.84GSEE67 pKa = 3.92AHH69 pKa = 6.13VPLSVRR75 pKa = 11.84IKK77 pKa = 10.45HH78 pKa = 5.83FLHH81 pKa = 6.18IGGRR85 pKa = 11.84RR86 pKa = 11.84HH87 pKa = 4.2TTTRR91 pKa = 11.84RR92 pKa = 11.84YY93 pKa = 9.93
Molecular weight: 10.49 kDa
Isoelectric point according different methods:
Peptides (in silico digests for buttom-up proteomics)
Below you can find in silico digests of the whole proteome with Trypsin, Chymotrypsin, Trypsin+LysC, LysN, ArgC proteases suitable for different mass spec machines.| Try ESI |
 |
|---|
| ChTry ESI |
 |
|---|
| ArgC ESI |
 |
|---|
| LysN ESI |
 |
|---|
| TryLysC ESI |
 |
|---|
| Try MALDI |
 |
|---|
| ChTry MALDI |
 |
|---|
| ArgC MALDI |
 |
|---|
| LysN MALDI |
 |
|---|
| TryLysC MALDI |
 |
|---|
| Try LTQ |
 |
|---|
| ChTry LTQ |
 |
|---|
| ArgC LTQ |
 |
|---|
| LysN LTQ |
 |
|---|
| TryLysC LTQ |
 |
|---|
| Try MSlow |
 |
|---|
| ChTry MSlow |
 |
|---|
| ArgC MSlow |
 |
|---|
| LysN MSlow |
 |
|---|
| TryLysC MSlow |
 |
|---|
| Try MShigh |
 |
|---|
| ChTry MShigh |
 |
|---|
| ArgC MShigh |
 |
|---|
| LysN MShigh |
 |
|---|
| TryLysC MShigh |
 |
|---|
General Statistics
Number of major isoforms |
Number of additional isoforms |
Number of all proteins |
Number of amino acids |
Min. Seq. Length |
Max. Seq. Length |
Avg. Seq. Length |
Avg. Mol. Weight |
|---|---|---|---|---|---|---|---|
0 |
5771931 |
66 |
7643 |
457.6 |
50.43 |
Amino acid frequency
Ala |
Cys |
Asp |
Glu |
Phe |
Gly |
His |
Ile |
Lys |
Leu |
|---|---|---|---|---|---|---|---|---|---|
8.554 ± 0.016 | 1.182 ± 0.008 |
5.415 ± 0.016 | 5.852 ± 0.021 |
3.478 ± 0.014 | 6.789 ± 0.022 |
2.492 ± 0.01 | 4.957 ± 0.017 |
4.62 ± 0.019 | 8.913 ± 0.024 |
Met |
Asn |
Gln |
Pro |
Arg |
Ser |
Thr |
Val |
Trp |
Tyr |
|---|---|---|---|---|---|---|---|---|---|
2.027 ± 0.008 | 3.631 ± 0.012 |
6.699 ± 0.027 | 3.813 ± 0.015 |
6.135 ± 0.023 | 8.717 ± 0.023 |
6.283 ± 0.017 | 6.248 ± 0.015 |
1.463 ± 0.008 | 2.699 ± 0.012 |
Most of the basic statistics you can see at this page can be downloaded from this CSV file
Proteome-pI is available under Creative Commons Attribution-NoDerivs license, for more details see here
| Reference: Kozlowski LP. Proteome-pI 2.0: Proteome Isoelectric Point Database Update. Nucleic Acids Res. 2021, doi: 10.1093/nar/gkab944 | Contact: Lukasz P. Kozlowski |
