Tyto alba (Barn owl)
Taxonomy: cellular organisms; Eukaryota; Opisthokonta; Metazoa; Eumetazoa; Bilateria; Deuterostomia; Chordata; Craniata; Vertebrata; Gnathostomata; Teleostomi; Euteleostomi; Sarcopterygii; Dipnotetrapodomorpha; Tetrapoda; Amniota; Sauropsida; Sauria; Archelosauria; Archosauria;
Average proteome isoelectric point is 6.67
Get precalculated fractions of proteins
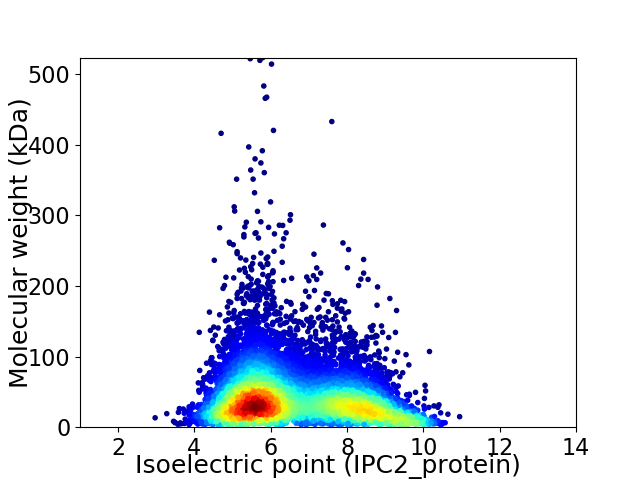
Virtual 2D-PAGE plot for 9263 proteins (isoelectric point calculated using IPC2_protein)
Get csv file with sequences according to given criteria:
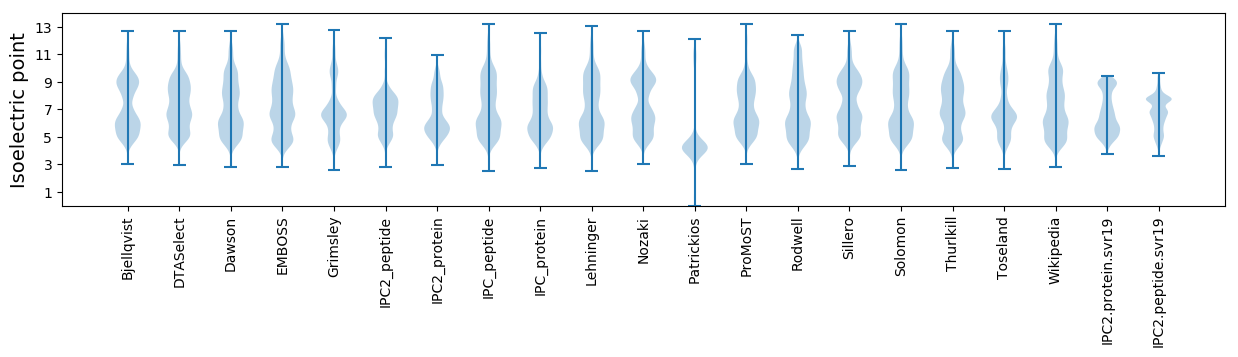
* You can choose from 21 different methods for calculating isoelectric point
Summary statistics related to proteome-wise predictions
Protein with the lowest isoelectric point:
>tr|A0A093F8X1|A0A093F8X1_TYTAL Replication protein A 14 kDa subunit (Fragment) OS=Tyto alba OX=56313 GN=N341_11129 PE=3 SV=1
MM1 pKa = 6.61TTGDD5 pKa = 3.89VLDD8 pKa = 4.17SCTAAEE14 pKa = 4.36LRR16 pKa = 11.84LDD18 pKa = 3.57SLYY21 pKa = 10.45LQRR24 pKa = 11.84MDD26 pKa = 3.06SHH28 pKa = 6.85KK29 pKa = 11.28ADD31 pKa = 3.85VLDD34 pKa = 3.89VLPKK38 pKa = 10.29QEE40 pKa = 4.48IQSSDD45 pKa = 3.5CQAAASDD52 pKa = 5.27AEE54 pKa = 4.46VQDD57 pKa = 3.86PAKK60 pKa = 10.68GFLGHH65 pKa = 5.7YY66 pKa = 5.19TTPKK70 pKa = 10.16VVLSADD76 pKa = 3.56APQTEE81 pKa = 4.25ATEE84 pKa = 4.56CEE86 pKa = 4.3VGLPDD91 pKa = 4.69TYY93 pKa = 11.13LSPAADD99 pKa = 3.36SCEE102 pKa = 3.82NMSLATTDD110 pKa = 4.45KK111 pKa = 11.08GDD113 pKa = 3.78LPHH116 pKa = 7.51SIVYY120 pKa = 10.04QNEE123 pKa = 3.61EE124 pKa = 4.41GKK126 pKa = 9.57WVTDD130 pKa = 3.51LAYY133 pKa = 9.07YY134 pKa = 10.17TSFDD138 pKa = 3.77EE139 pKa = 4.71EE140 pKa = 3.89QDD142 pKa = 3.93LNLSEE147 pKa = 5.07DD148 pKa = 3.61DD149 pKa = 4.97KK150 pKa = 11.59INEE153 pKa = 4.8FITT156 pKa = 3.67
MM1 pKa = 6.61TTGDD5 pKa = 3.89VLDD8 pKa = 4.17SCTAAEE14 pKa = 4.36LRR16 pKa = 11.84LDD18 pKa = 3.57SLYY21 pKa = 10.45LQRR24 pKa = 11.84MDD26 pKa = 3.06SHH28 pKa = 6.85KK29 pKa = 11.28ADD31 pKa = 3.85VLDD34 pKa = 3.89VLPKK38 pKa = 10.29QEE40 pKa = 4.48IQSSDD45 pKa = 3.5CQAAASDD52 pKa = 5.27AEE54 pKa = 4.46VQDD57 pKa = 3.86PAKK60 pKa = 10.68GFLGHH65 pKa = 5.7YY66 pKa = 5.19TTPKK70 pKa = 10.16VVLSADD76 pKa = 3.56APQTEE81 pKa = 4.25ATEE84 pKa = 4.56CEE86 pKa = 4.3VGLPDD91 pKa = 4.69TYY93 pKa = 11.13LSPAADD99 pKa = 3.36SCEE102 pKa = 3.82NMSLATTDD110 pKa = 4.45KK111 pKa = 11.08GDD113 pKa = 3.78LPHH116 pKa = 7.51SIVYY120 pKa = 10.04QNEE123 pKa = 3.61EE124 pKa = 4.41GKK126 pKa = 9.57WVTDD130 pKa = 3.51LAYY133 pKa = 9.07YY134 pKa = 10.17TSFDD138 pKa = 3.77EE139 pKa = 4.71EE140 pKa = 3.89QDD142 pKa = 3.93LNLSEE147 pKa = 5.07DD148 pKa = 3.61DD149 pKa = 4.97KK150 pKa = 11.59INEE153 pKa = 4.8FITT156 pKa = 3.67
Molecular weight: 17.09 kDa
Isoelectric point according different methods:
Protein with the highest isoelectric point:
>tr|A0A093F4G9|A0A093F4G9_TYTAL Katanin p60 ATPase-containing subunit A-like 1 (Fragment) OS=Tyto alba OX=56313 GN=N341_10014 PE=3 SV=1
MM1 pKa = 7.67AAQSAPKK8 pKa = 10.16VVLKK12 pKa = 10.04STTKK16 pKa = 9.35MSLNEE21 pKa = 4.25RR22 pKa = 11.84FTNMLKK28 pKa = 10.36NKK30 pKa = 9.73QPMPVNIRR38 pKa = 11.84ATMQQQQQLASARR51 pKa = 11.84NRR53 pKa = 11.84RR54 pKa = 11.84LAQQMEE60 pKa = 4.32NRR62 pKa = 11.84PSVQAALKK70 pKa = 10.37LKK72 pKa = 10.39QKK74 pKa = 9.42SLKK77 pKa = 9.72QRR79 pKa = 11.84LGKK82 pKa = 10.77SNIQARR88 pKa = 11.84LGRR91 pKa = 11.84PAGPLARR98 pKa = 11.84GAMGGRR104 pKa = 11.84GLSMGQRR111 pKa = 11.84GLPRR115 pKa = 11.84GAMRR119 pKa = 11.84GGRR122 pKa = 11.84GARR125 pKa = 11.84ALLRR129 pKa = 11.84GGVPLRR135 pKa = 11.84GQQ137 pKa = 3.17
MM1 pKa = 7.67AAQSAPKK8 pKa = 10.16VVLKK12 pKa = 10.04STTKK16 pKa = 9.35MSLNEE21 pKa = 4.25RR22 pKa = 11.84FTNMLKK28 pKa = 10.36NKK30 pKa = 9.73QPMPVNIRR38 pKa = 11.84ATMQQQQQLASARR51 pKa = 11.84NRR53 pKa = 11.84RR54 pKa = 11.84LAQQMEE60 pKa = 4.32NRR62 pKa = 11.84PSVQAALKK70 pKa = 10.37LKK72 pKa = 10.39QKK74 pKa = 9.42SLKK77 pKa = 9.72QRR79 pKa = 11.84LGKK82 pKa = 10.77SNIQARR88 pKa = 11.84LGRR91 pKa = 11.84PAGPLARR98 pKa = 11.84GAMGGRR104 pKa = 11.84GLSMGQRR111 pKa = 11.84GLPRR115 pKa = 11.84GAMRR119 pKa = 11.84GGRR122 pKa = 11.84GARR125 pKa = 11.84ALLRR129 pKa = 11.84GGVPLRR135 pKa = 11.84GQQ137 pKa = 3.17
Molecular weight: 14.88 kDa
Isoelectric point according different methods:
Peptides (in silico digests for buttom-up proteomics)
Below you can find in silico digests of the whole proteome with Trypsin, Chymotrypsin, Trypsin+LysC, LysN, ArgC proteases suitable for different mass spec machines.| Try ESI |
 |
|---|
| ChTry ESI |
|
|---|
| ArgC ESI |
|
|---|
| LysN ESI |
|
|---|
| TryLysC ESI |
|
|---|
| Try MALDI |
|
|---|
| ChTry MALDI |
|
|---|
| ArgC MALDI |
|
|---|
| LysN MALDI |
|
|---|
| TryLysC MALDI |
|
|---|
| Try LTQ |
|
|---|
| ChTry LTQ |
|
|---|
| ArgC LTQ |
|
|---|
| LysN LTQ |
|
|---|
| TryLysC LTQ |
|
|---|
| Try MSlow |
|
|---|
| ChTry MSlow |
|
|---|
| ArgC MSlow |
|
|---|
| LysN MSlow |
|
|---|
| TryLysC MSlow |
|
|---|
| Try MShigh |
|
|---|
| ChTry MShigh |
|
|---|
| ArgC MShigh |
|
|---|
| LysN MShigh |
|
|---|
| TryLysC MShigh |
|
|---|
General Statistics
Number of major isoforms |
Number of additional isoforms |
Number of all proteins |
Number of amino acids |
Min. Seq. Length |
Max. Seq. Length |
Avg. Seq. Length |
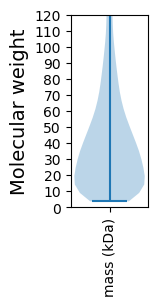
Avg. Mol. Weight |
|---|---|---|---|---|---|---|---|
0 |
3777475 |
31 |
4763 |
407.8 |
45.92 |
Amino acid frequency
Ala |
Cys |
Asp |
Glu |
Phe |
Gly |
His |
Ile |
Lys |
Leu |
|---|---|---|---|---|---|---|---|---|---|
6.212 ± 0.023 | 2.218 ± 0.019 |
5.064 ± 0.017 | 7.227 ± 0.034 |
4.003 ± 0.02 | 5.716 ± 0.033 |
2.536 ± 0.013 | 5.155 ± 0.019 |
6.628 ± 0.03 | 9.759 ± 0.035 |
Met |
Asn |
Gln |
Pro |
Arg |
Ser |
Thr |
Val |
Trp |
Tyr |
|---|---|---|---|---|---|---|---|---|---|
2.278 ± 0.011 | 4.258 ± 0.016 |
5.106 ± 0.031 | 4.655 ± 0.022 |
5.081 ± 0.018 | 8.185 ± 0.037 |
5.411 ± 0.018 | 6.281 ± 0.022 |
1.188 ± 0.009 | 3.034 ± 0.016 |
Most of the basic statistics you can see at this page can be downloaded from this CSV file
See this proteome in:

Proteome-pI is available under Creative Commons Attribution-NoDerivs license, for more details see here
| Reference: Kozlowski LP. Proteome-pI 2.0: Proteome Isoelectric Point Database Update. Nucleic Acids Res. 2021, doi: 10.1093/nar/gkab944 | Contact: Lukasz P. Kozlowski |