Roseovarius marisflavi
Taxonomy: cellular organisms; Bacteria; Proteobacteria; Alphaproteobacteria; Rhodobacterales; Roseobacteraceae; Roseovarius
Average proteome isoelectric point is 6.25
Get precalculated fractions of proteins

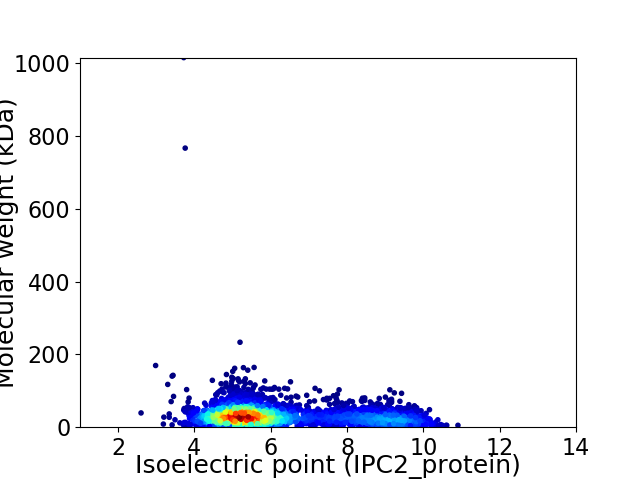
Virtual 2D-PAGE plot for 3958 proteins (isoelectric point calculated using IPC2_protein)
Get csv file with sequences according to given criteria:
* You can choose from 21 different methods for calculating isoelectric point
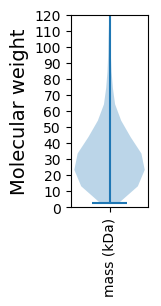
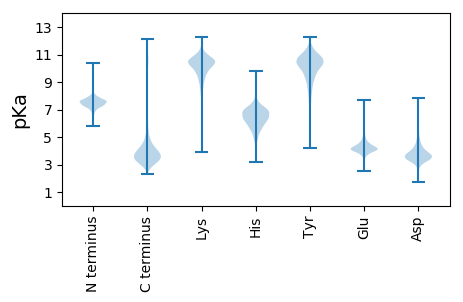
Summary statistics related to proteome-wise predictions


Protein with the lowest isoelectric point:
>tr|A0A1M7ALW3|A0A1M7ALW3_9RHOB Cu2+-exporting ATPase OS=Roseovarius marisflavi OX=1054996 GN=SAMN05444414_11432 PE=3 SV=1
MM1 pKa = 7.3SLKK4 pKa = 10.2TNIFMGALFASMPLALCAQDD24 pKa = 3.86AGGAFTLGYY33 pKa = 9.57GASSVSGPAGDD44 pKa = 5.4LSTLSLDD51 pKa = 3.66GVGNIALNNSFNIGLYY67 pKa = 10.41GSFRR71 pKa = 11.84SVDD74 pKa = 3.66EE75 pKa = 4.76NNTSDD80 pKa = 5.52DD81 pKa = 3.7LAASDD86 pKa = 5.62FGFTLNYY93 pKa = 9.94QFLNGVVLGGYY104 pKa = 9.89LDD106 pKa = 3.82YY107 pKa = 11.56AKK109 pKa = 10.9LDD111 pKa = 3.84FGSFATDD118 pKa = 4.16FDD120 pKa = 4.08TTSYY124 pKa = 10.67GGTVGYY130 pKa = 7.96VTNTFGAEE138 pKa = 3.73AFLGGTEE145 pKa = 4.12TSPDD149 pKa = 3.22LAAGVDD155 pKa = 3.39WVDD158 pKa = 3.06YY159 pKa = 10.47GLNLRR164 pKa = 11.84YY165 pKa = 9.67VVSPQARR172 pKa = 11.84LGGHH176 pKa = 6.24IMRR179 pKa = 11.84SDD181 pKa = 2.9ISVPGGTDD189 pKa = 3.35VEE191 pKa = 4.2IDD193 pKa = 3.45SYY195 pKa = 11.84GIGGDD200 pKa = 3.62YY201 pKa = 11.14AFGNGWSGFGGLSYY215 pKa = 11.4VDD217 pKa = 4.5LGAAAVDD224 pKa = 3.45ATTFGVGVGYY234 pKa = 10.49DD235 pKa = 3.55LGQISRR241 pKa = 11.84LPASVSLEE249 pKa = 3.8LSRR252 pKa = 11.84TDD254 pKa = 3.07ISAPGADD261 pKa = 3.71ADD263 pKa = 3.93VDD265 pKa = 4.03TLRR268 pKa = 11.84LSLTVPLGNRR278 pKa = 11.84PSTTPLNSVARR289 pKa = 11.84SAMAPRR295 pKa = 11.84HH296 pKa = 5.35NAVSTLLEE304 pKa = 4.15SAFF307 pKa = 3.84
MM1 pKa = 7.3SLKK4 pKa = 10.2TNIFMGALFASMPLALCAQDD24 pKa = 3.86AGGAFTLGYY33 pKa = 9.57GASSVSGPAGDD44 pKa = 5.4LSTLSLDD51 pKa = 3.66GVGNIALNNSFNIGLYY67 pKa = 10.41GSFRR71 pKa = 11.84SVDD74 pKa = 3.66EE75 pKa = 4.76NNTSDD80 pKa = 5.52DD81 pKa = 3.7LAASDD86 pKa = 5.62FGFTLNYY93 pKa = 9.94QFLNGVVLGGYY104 pKa = 9.89LDD106 pKa = 3.82YY107 pKa = 11.56AKK109 pKa = 10.9LDD111 pKa = 3.84FGSFATDD118 pKa = 4.16FDD120 pKa = 4.08TTSYY124 pKa = 10.67GGTVGYY130 pKa = 7.96VTNTFGAEE138 pKa = 3.73AFLGGTEE145 pKa = 4.12TSPDD149 pKa = 3.22LAAGVDD155 pKa = 3.39WVDD158 pKa = 3.06YY159 pKa = 10.47GLNLRR164 pKa = 11.84YY165 pKa = 9.67VVSPQARR172 pKa = 11.84LGGHH176 pKa = 6.24IMRR179 pKa = 11.84SDD181 pKa = 2.9ISVPGGTDD189 pKa = 3.35VEE191 pKa = 4.2IDD193 pKa = 3.45SYY195 pKa = 11.84GIGGDD200 pKa = 3.62YY201 pKa = 11.14AFGNGWSGFGGLSYY215 pKa = 11.4VDD217 pKa = 4.5LGAAAVDD224 pKa = 3.45ATTFGVGVGYY234 pKa = 10.49DD235 pKa = 3.55LGQISRR241 pKa = 11.84LPASVSLEE249 pKa = 3.8LSRR252 pKa = 11.84TDD254 pKa = 3.07ISAPGADD261 pKa = 3.71ADD263 pKa = 3.93VDD265 pKa = 4.03TLRR268 pKa = 11.84LSLTVPLGNRR278 pKa = 11.84PSTTPLNSVARR289 pKa = 11.84SAMAPRR295 pKa = 11.84HH296 pKa = 5.35NAVSTLLEE304 pKa = 4.15SAFF307 pKa = 3.84
Molecular weight: 31.59 kDa
Isoelectric point according different methods:
Protein with the highest isoelectric point:
>tr|A0A1M7AE79|A0A1M7AE79_9RHOB Uncharacterized protein OS=Roseovarius marisflavi OX=1054996 GN=SAMN05444414_11348 PE=4 SV=1
MM1 pKa = 7.45KK2 pKa = 9.61RR3 pKa = 11.84TFQPSNLVRR12 pKa = 11.84KK13 pKa = 9.18RR14 pKa = 11.84RR15 pKa = 11.84HH16 pKa = 4.42GFRR19 pKa = 11.84ARR21 pKa = 11.84MATKK25 pKa = 10.37AGRR28 pKa = 11.84KK29 pKa = 8.54ILNARR34 pKa = 11.84RR35 pKa = 11.84ARR37 pKa = 11.84GRR39 pKa = 11.84KK40 pKa = 8.43EE41 pKa = 3.72LSAA44 pKa = 5.03
MM1 pKa = 7.45KK2 pKa = 9.61RR3 pKa = 11.84TFQPSNLVRR12 pKa = 11.84KK13 pKa = 9.18RR14 pKa = 11.84RR15 pKa = 11.84HH16 pKa = 4.42GFRR19 pKa = 11.84ARR21 pKa = 11.84MATKK25 pKa = 10.37AGRR28 pKa = 11.84KK29 pKa = 8.54ILNARR34 pKa = 11.84RR35 pKa = 11.84ARR37 pKa = 11.84GRR39 pKa = 11.84KK40 pKa = 8.43EE41 pKa = 3.72LSAA44 pKa = 5.03
Molecular weight: 5.18 kDa
Isoelectric point according different methods:
Peptides (in silico digests for buttom-up proteomics)
Below you can find in silico digests of the whole proteome with Trypsin, Chymotrypsin, Trypsin+LysC, LysN, ArgC proteases suitable for different mass spec machines.| Try ESI |
 |
|---|
| ChTry ESI |
 |
|---|
| ArgC ESI |
 |
|---|
| LysN ESI |
 |
|---|
| TryLysC ESI |
 |
|---|
| Try MALDI |
 |
|---|
| ChTry MALDI |
 |
|---|
| ArgC MALDI |
 |
|---|
| LysN MALDI |
 |
|---|
| TryLysC MALDI |
 |
|---|
| Try LTQ |
 |
|---|
| ChTry LTQ |
 |
|---|
| ArgC LTQ |
 |
|---|
| LysN LTQ |
 |
|---|
| TryLysC LTQ |
 |
|---|
| Try MSlow |
 |
|---|
| ChTry MSlow |
 |
|---|
| ArgC MSlow |
 |
|---|
| LysN MSlow |
 |
|---|
| TryLysC MSlow |
 |
|---|
| Try MShigh |
 |
|---|
| ChTry MShigh |
 |
|---|
| ArgC MShigh |
 |
|---|
| LysN MShigh |
 |
|---|
| TryLysC MShigh |
 |
|---|
General Statistics
Number of major isoforms |
Number of additional isoforms |
Number of all proteins |
Number of amino acids |
Min. Seq. Length |
Max. Seq. Length |
Avg. Seq. Length |
Avg. Mol. Weight |
|---|---|---|---|---|---|---|---|
0 |
1212272 |
24 |
9929 |
306.3 |
33.24 |
Amino acid frequency
Ala |
Cys |
Asp |
Glu |
Phe |
Gly |
His |
Ile |
Lys |
Leu |
|---|---|---|---|---|---|---|---|---|---|
12.116 ± 0.051 | 0.947 ± 0.016 |
6.048 ± 0.05 | 5.75 ± 0.033 |
3.711 ± 0.023 | 8.803 ± 0.063 |
2.115 ± 0.025 | 5.33 ± 0.029 |
3.269 ± 0.03 | 10.038 ± 0.055 |
Met |
Asn |
Gln |
Pro |
Arg |
Ser |
Thr |
Val |
Trp |
Tyr |
|---|---|---|---|---|---|---|---|---|---|
2.869 ± 0.026 | 2.659 ± 0.031 |
4.994 ± 0.035 | 3.148 ± 0.021 |
6.629 ± 0.052 | 5.218 ± 0.034 |
5.485 ± 0.048 | 7.241 ± 0.032 |
1.375 ± 0.019 | 2.256 ± 0.021 |
Most of the basic statistics you can see at this page can be downloaded from this CSV file
Proteome-pI is available under Creative Commons Attribution-NoDerivs license, for more details see here
| Reference: Kozlowski LP. Proteome-pI 2.0: Proteome Isoelectric Point Database Update. Nucleic Acids Res. 2021, doi: 10.1093/nar/gkab944 | Contact: Lukasz P. Kozlowski |
