Yellowstone Lake virophage 5
Taxonomy: Viruses; Varidnaviria; Bamfordvirae; Preplasmiviricota; Maveriviricetes; Priklausovirales; Lavidaviridae; unclassified Lavidaviridae
Average proteome isoelectric point is 6.92
Get precalculated fractions of proteins

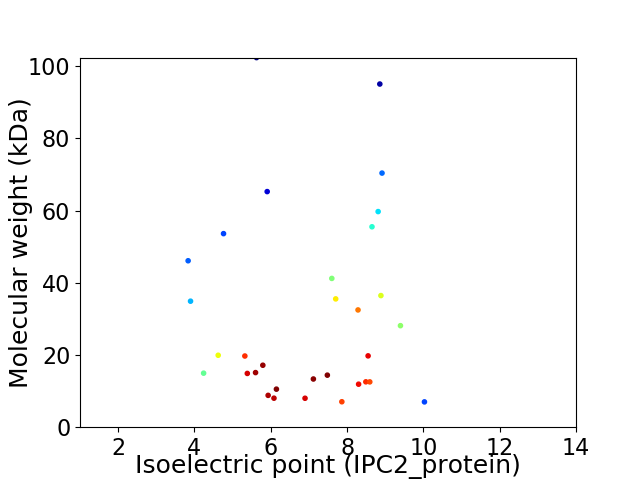
Virtual 2D-PAGE plot for 32 proteins (isoelectric point calculated using IPC2_protein)
Get csv file with sequences according to given criteria:
* You can choose from 21 different methods for calculating isoelectric point
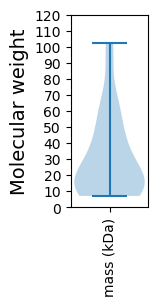
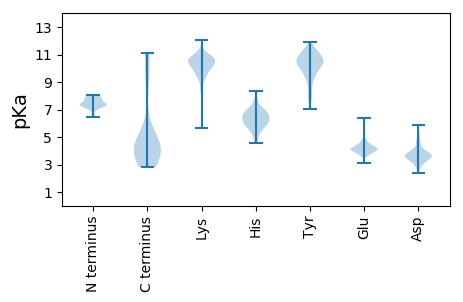
Summary statistics related to proteome-wise predictions


Protein with the lowest isoelectric point:
>tr|A0A0A0RJS4|A0A0A0RJS4_9VIRU Uncharacterized protein OS=Yellowstone Lake virophage 5 OX=1557033 GN=YSLV5_ORF08 PE=4 SV=1
MM1 pKa = 7.39SSVASILTGTPAVVNPALVSGGGGGGSTAPQFTATGVAGAGGFVSSGAGANVTLNNGTFVSYY63 pKa = 11.32VDD65 pKa = 3.85TLAVPPGGAEE75 pKa = 4.07VVVLGSDD82 pKa = 3.24VGGNGPRR89 pKa = 11.84WTIGYY94 pKa = 9.24NNSDD98 pKa = 3.53VGDD101 pKa = 4.11GFAGADD107 pKa = 3.75LAVKK111 pKa = 10.12CYY113 pKa = 10.79ADD115 pKa = 4.88DD116 pKa = 4.52GNLIATPFSIARR128 pKa = 11.84DD129 pKa = 3.61TGIVSMPEE137 pKa = 3.73SFEE140 pKa = 4.06ASAGEE145 pKa = 4.26VGAPATVGGGVLNINGTLGLSRR167 pKa = 11.84VYY169 pKa = 10.51DD170 pKa = 3.31QLYY173 pKa = 9.99NVPPATAQGAYY184 pKa = 10.14AFQSTKK190 pKa = 10.41LAASTFVDD198 pKa = 5.81FISNGNSTIITAPVPVGAQNASIFKK223 pKa = 10.18LRR225 pKa = 11.84VVGGWTYY232 pKa = 9.17ATPSGFIANMAIYY245 pKa = 10.02GATDD249 pKa = 3.73PAALVPDD256 pKa = 4.5DD257 pKa = 4.1TSMDD261 pKa = 3.34TVMVYY266 pKa = 10.73DD267 pKa = 4.43VFSGDD272 pKa = 3.46QIRR275 pKa = 11.84FEE277 pKa = 4.56VNPHH281 pKa = 5.94FLVGSEE287 pKa = 3.97AVSLVYY293 pKa = 10.31LRR295 pKa = 11.84EE296 pKa = 3.97MVFTVTNPTLATVTNLYY313 pKa = 10.5LVVRR317 pKa = 11.84PTPADD322 pKa = 3.57GSQTIGSVTTDD333 pKa = 2.93NGGPTYY339 pKa = 10.78ANCEE343 pKa = 4.0AYY345 pKa = 10.49LL346 pKa = 3.88
MM1 pKa = 7.39SSVASILTGTPAVVNPALVSGGGGGGSTAPQFTATGVAGAGGFVSSGAGANVTLNNGTFVSYY63 pKa = 11.32VDD65 pKa = 3.85TLAVPPGGAEE75 pKa = 4.07VVVLGSDD82 pKa = 3.24VGGNGPRR89 pKa = 11.84WTIGYY94 pKa = 9.24NNSDD98 pKa = 3.53VGDD101 pKa = 4.11GFAGADD107 pKa = 3.75LAVKK111 pKa = 10.12CYY113 pKa = 10.79ADD115 pKa = 4.88DD116 pKa = 4.52GNLIATPFSIARR128 pKa = 11.84DD129 pKa = 3.61TGIVSMPEE137 pKa = 3.73SFEE140 pKa = 4.06ASAGEE145 pKa = 4.26VGAPATVGGGVLNINGTLGLSRR167 pKa = 11.84VYY169 pKa = 10.51DD170 pKa = 3.31QLYY173 pKa = 9.99NVPPATAQGAYY184 pKa = 10.14AFQSTKK190 pKa = 10.41LAASTFVDD198 pKa = 5.81FISNGNSTIITAPVPVGAQNASIFKK223 pKa = 10.18LRR225 pKa = 11.84VVGGWTYY232 pKa = 9.17ATPSGFIANMAIYY245 pKa = 10.02GATDD249 pKa = 3.73PAALVPDD256 pKa = 4.5DD257 pKa = 4.1TSMDD261 pKa = 3.34TVMVYY266 pKa = 10.73DD267 pKa = 4.43VFSGDD272 pKa = 3.46QIRR275 pKa = 11.84FEE277 pKa = 4.56VNPHH281 pKa = 5.94FLVGSEE287 pKa = 3.97AVSLVYY293 pKa = 10.31LRR295 pKa = 11.84EE296 pKa = 3.97MVFTVTNPTLATVTNLYY313 pKa = 10.5LVVRR317 pKa = 11.84PTPADD322 pKa = 3.57GSQTIGSVTTDD333 pKa = 2.93NGGPTYY339 pKa = 10.78ANCEE343 pKa = 4.0AYY345 pKa = 10.49LL346 pKa = 3.88
Molecular weight: 34.9 kDa
Isoelectric point according different methods:
Protein with the highest isoelectric point:
>tr|A0A0A0RPA2|A0A0A0RPA2_9VIRU Uncharacterized protein OS=Yellowstone Lake virophage 5 OX=1557033 GN=YSLV5_ORF04 PE=4 SV=1
MM1 pKa = 7.84GYY3 pKa = 10.48LCFLLPLLPLGQPFLVVIPRR23 pKa = 11.84RR24 pKa = 11.84RR25 pKa = 11.84IRR27 pKa = 11.84PIKK30 pKa = 9.66VSHH33 pKa = 6.43SGFGTTTSSSHH44 pKa = 6.37SEE46 pKa = 4.07EE47 pKa = 4.01AKK49 pKa = 10.69LPYY52 pKa = 9.84KK53 pKa = 9.73SLRR56 pKa = 11.84RR57 pKa = 11.84NFSAHH62 pKa = 5.32
MM1 pKa = 7.84GYY3 pKa = 10.48LCFLLPLLPLGQPFLVVIPRR23 pKa = 11.84RR24 pKa = 11.84RR25 pKa = 11.84IRR27 pKa = 11.84PIKK30 pKa = 9.66VSHH33 pKa = 6.43SGFGTTTSSSHH44 pKa = 6.37SEE46 pKa = 4.07EE47 pKa = 4.01AKK49 pKa = 10.69LPYY52 pKa = 9.84KK53 pKa = 9.73SLRR56 pKa = 11.84RR57 pKa = 11.84NFSAHH62 pKa = 5.32
Molecular weight: 7.01 kDa
Isoelectric point according different methods:
Peptides (in silico digests for buttom-up proteomics)
Below you can find in silico digests of the whole proteome with Trypsin, Chymotrypsin, Trypsin+LysC, LysN, ArgC proteases suitable for different mass spec machines.| Try ESI |
 |
|---|
| ChTry ESI |
 |
|---|
| ArgC ESI |
 |
|---|
| LysN ESI |
 |
|---|
| TryLysC ESI |
 |
|---|
| Try MALDI |
 |
|---|
| ChTry MALDI |
 |
|---|
| ArgC MALDI |
 |
|---|
| LysN MALDI |
 |
|---|
| TryLysC MALDI |
 |
|---|
| Try LTQ |
 |
|---|
| ChTry LTQ |
 |
|---|
| ArgC LTQ |
 |
|---|
| LysN LTQ |
 |
|---|
| TryLysC LTQ |
 |
|---|
| Try MSlow |
 |
|---|
| ChTry MSlow |
 |
|---|
| ArgC MSlow |
 |
|---|
| LysN MSlow |
 |
|---|
| TryLysC MSlow |
 |
|---|
| Try MShigh |
 |
|---|
| ChTry MShigh |
 |
|---|
| ArgC MShigh |
 |
|---|
| LysN MShigh |
 |
|---|
| TryLysC MShigh |
 |
|---|
General Statistics
Number of major isoforms |
Number of additional isoforms |
Number of all proteins |
Number of amino acids |
Min. Seq. Length |
Max. Seq. Length |
Avg. Seq. Length |
Avg. Mol. Weight |
|---|---|---|---|---|---|---|---|
0 |
8954 |
62 |
904 |
279.8 |
31.01 |
Amino acid frequency
Ala |
Cys |
Asp |
Glu |
Phe |
Gly |
His |
Ile |
Lys |
Leu |
|---|---|---|---|---|---|---|---|---|---|
8.745 ± 0.413 | 1.284 ± 0.251 |
5.696 ± 0.321 | 6.243 ± 0.586 |
3.864 ± 0.203 | 7.807 ± 0.598 |
1.619 ± 0.2 | 5.149 ± 0.313 |
7.058 ± 0.839 | 7.628 ± 0.428 |
Met |
Asn |
Gln |
Pro |
Arg |
Ser |
Thr |
Val |
Trp |
Tyr |
|---|---|---|---|---|---|---|---|---|---|
2.602 ± 0.195 | 4.177 ± 0.328 |
5.484 ± 0.374 | 2.937 ± 0.23 |
5.461 ± 0.483 | 6.768 ± 0.514 |
5.997 ± 0.573 | 6.299 ± 0.371 |
1.273 ± 0.147 | 3.909 ± 0.297 |
Most of the basic statistics you can see at this page can be downloaded from this CSV file
Proteome-pI is available under Creative Commons Attribution-NoDerivs license, for more details see here
| Reference: Kozlowski LP. Proteome-pI 2.0: Proteome Isoelectric Point Database Update. Nucleic Acids Res. 2021, doi: 10.1093/nar/gkab944 | Contact: Lukasz P. Kozlowski |
