Georhizobium profundi
Taxonomy: cellular organisms; Bacteria; Proteobacteria; Alphaproteobacteria; Hyphomicrobiales; Rhizobiaceae; Georhizobium
Average proteome isoelectric point is 6.2
Get precalculated fractions of proteins

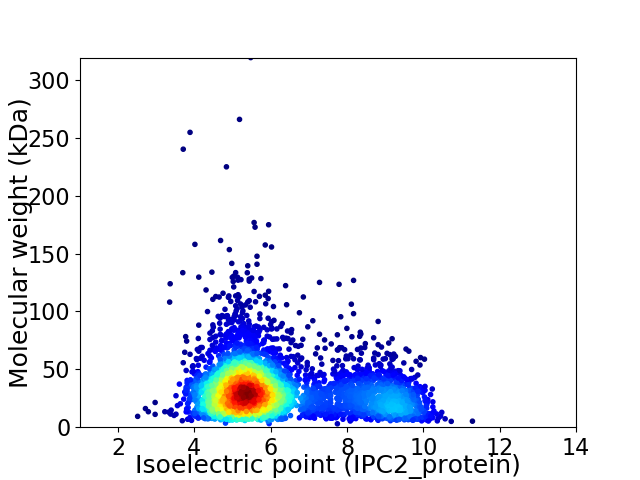
Virtual 2D-PAGE plot for 4118 proteins (isoelectric point calculated using IPC2_protein)
Get csv file with sequences according to given criteria:
* You can choose from 21 different methods for calculating isoelectric point
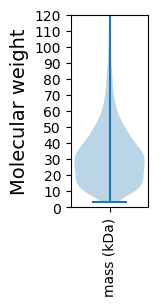
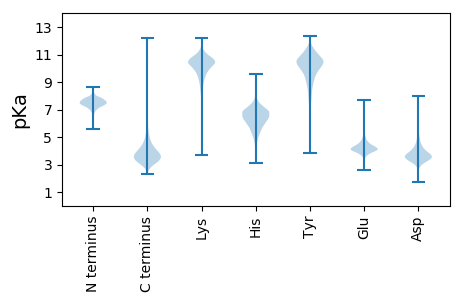
Summary statistics related to proteome-wise predictions


Protein with the lowest isoelectric point:
>tr|A0A3S9B9X6|A0A3S9B9X6_9RHIZ Urea ABC transporter permease subunit UrtB OS=Georhizobium profundi OX=2341112 GN=urtB PE=4 SV=1
MM1 pKa = 7.54APAAMAQDD9 pKa = 3.57AAGMPEE15 pKa = 4.03EE16 pKa = 4.46TGDD19 pKa = 5.08LITATATLEE28 pKa = 4.11GDD30 pKa = 4.05GIEE33 pKa = 4.37GTVTLTEE40 pKa = 4.31TPTGIVIIEE49 pKa = 4.07IEE51 pKa = 4.14ASGLEE56 pKa = 4.15PGPHH60 pKa = 5.77GVHH63 pKa = 5.8LHH65 pKa = 5.16EE66 pKa = 5.54TGTCDD71 pKa = 4.38AEE73 pKa = 4.81GGHH76 pKa = 6.06EE77 pKa = 3.87AAGGHH82 pKa = 4.84VSGDD86 pKa = 3.71GEE88 pKa = 4.44HH89 pKa = 7.13GVLNPNGPHH98 pKa = 7.01PGDD101 pKa = 3.69LPNVHH106 pKa = 5.54VQEE109 pKa = 5.18DD110 pKa = 5.18GIAHH114 pKa = 6.83AEE116 pKa = 4.09FFVSDD121 pKa = 3.37IALSGDD127 pKa = 3.44AGTVILDD134 pKa = 3.74DD135 pKa = 5.37DD136 pKa = 4.21GAAFIIHH143 pKa = 7.1AGADD147 pKa = 3.55DD148 pKa = 4.44YY149 pKa = 10.53MTDD152 pKa = 3.61PAGDD156 pKa = 3.44SGDD159 pKa = 4.42RR160 pKa = 11.84IACGVIEE167 pKa = 4.41AANN170 pKa = 3.31
MM1 pKa = 7.54APAAMAQDD9 pKa = 3.57AAGMPEE15 pKa = 4.03EE16 pKa = 4.46TGDD19 pKa = 5.08LITATATLEE28 pKa = 4.11GDD30 pKa = 4.05GIEE33 pKa = 4.37GTVTLTEE40 pKa = 4.31TPTGIVIIEE49 pKa = 4.07IEE51 pKa = 4.14ASGLEE56 pKa = 4.15PGPHH60 pKa = 5.77GVHH63 pKa = 5.8LHH65 pKa = 5.16EE66 pKa = 5.54TGTCDD71 pKa = 4.38AEE73 pKa = 4.81GGHH76 pKa = 6.06EE77 pKa = 3.87AAGGHH82 pKa = 4.84VSGDD86 pKa = 3.71GEE88 pKa = 4.44HH89 pKa = 7.13GVLNPNGPHH98 pKa = 7.01PGDD101 pKa = 3.69LPNVHH106 pKa = 5.54VQEE109 pKa = 5.18DD110 pKa = 5.18GIAHH114 pKa = 6.83AEE116 pKa = 4.09FFVSDD121 pKa = 3.37IALSGDD127 pKa = 3.44AGTVILDD134 pKa = 3.74DD135 pKa = 5.37DD136 pKa = 4.21GAAFIIHH143 pKa = 7.1AGADD147 pKa = 3.55DD148 pKa = 4.44YY149 pKa = 10.53MTDD152 pKa = 3.61PAGDD156 pKa = 3.44SGDD159 pKa = 4.42RR160 pKa = 11.84IACGVIEE167 pKa = 4.41AANN170 pKa = 3.31
Molecular weight: 16.94 kDa
Isoelectric point according different methods:
Protein with the highest isoelectric point:
>tr|A0A3S9AZD4|A0A3S9AZD4_9RHIZ LysR family transcriptional regulator OS=Georhizobium profundi OX=2341112 GN=D5400_01175 PE=3 SV=1
MM1 pKa = 7.51TKK3 pKa = 9.11RR4 pKa = 11.84TFQPSKK10 pKa = 9.84LVRR13 pKa = 11.84KK14 pKa = 9.15RR15 pKa = 11.84RR16 pKa = 11.84HH17 pKa = 4.42GFRR20 pKa = 11.84ARR22 pKa = 11.84MATAGGRR29 pKa = 11.84KK30 pKa = 8.88VLAARR35 pKa = 11.84RR36 pKa = 11.84ARR38 pKa = 11.84GRR40 pKa = 11.84KK41 pKa = 9.03RR42 pKa = 11.84LSAA45 pKa = 4.03
MM1 pKa = 7.51TKK3 pKa = 9.11RR4 pKa = 11.84TFQPSKK10 pKa = 9.84LVRR13 pKa = 11.84KK14 pKa = 9.15RR15 pKa = 11.84RR16 pKa = 11.84HH17 pKa = 4.42GFRR20 pKa = 11.84ARR22 pKa = 11.84MATAGGRR29 pKa = 11.84KK30 pKa = 8.88VLAARR35 pKa = 11.84RR36 pKa = 11.84ARR38 pKa = 11.84GRR40 pKa = 11.84KK41 pKa = 9.03RR42 pKa = 11.84LSAA45 pKa = 4.03
Molecular weight: 5.19 kDa
Isoelectric point according different methods:
Peptides (in silico digests for buttom-up proteomics)
Below you can find in silico digests of the whole proteome with Trypsin, Chymotrypsin, Trypsin+LysC, LysN, ArgC proteases suitable for different mass spec machines.| Try ESI |
 |
|---|
| ChTry ESI |
 |
|---|
| ArgC ESI |
 |
|---|
| LysN ESI |
 |
|---|
| TryLysC ESI |
 |
|---|
| Try MALDI |
 |
|---|
| ChTry MALDI |
 |
|---|
| ArgC MALDI |
 |
|---|
| LysN MALDI |
 |
|---|
| TryLysC MALDI |
 |
|---|
| Try LTQ |
 |
|---|
| ChTry LTQ |
 |
|---|
| ArgC LTQ |
 |
|---|
| LysN LTQ |
 |
|---|
| TryLysC LTQ |
 |
|---|
| Try MSlow |
 |
|---|
| ChTry MSlow |
 |
|---|
| ArgC MSlow |
 |
|---|
| LysN MSlow |
 |
|---|
| TryLysC MSlow |
 |
|---|
| Try MShigh |
 |
|---|
| ChTry MShigh |
 |
|---|
| ArgC MShigh |
 |
|---|
| LysN MShigh |
 |
|---|
| TryLysC MShigh |
 |
|---|
General Statistics
Number of major isoforms |
Number of additional isoforms |
Number of all proteins |
Number of amino acids |
Min. Seq. Length |
Max. Seq. Length |
Avg. Seq. Length |
Avg. Mol. Weight |
|---|---|---|---|---|---|---|---|
0 |
1291389 |
28 |
2867 |
313.6 |
34.05 |
Amino acid frequency
Ala |
Cys |
Asp |
Glu |
Phe |
Gly |
His |
Ile |
Lys |
Leu |
|---|---|---|---|---|---|---|---|---|---|
12.399 ± 0.048 | 0.78 ± 0.012 |
6.06 ± 0.037 | 6.023 ± 0.034 |
3.854 ± 0.021 | 8.474 ± 0.042 |
2.029 ± 0.02 | 5.609 ± 0.028 |
3.035 ± 0.03 | 9.821 ± 0.042 |
Met |
Asn |
Gln |
Pro |
Arg |
Ser |
Thr |
Val |
Trp |
Tyr |
|---|---|---|---|---|---|---|---|---|---|
2.621 ± 0.019 | 2.607 ± 0.025 |
4.895 ± 0.026 | 3.104 ± 0.022 |
7.066 ± 0.049 | 5.563 ± 0.027 |
5.34 ± 0.028 | 7.334 ± 0.034 |
1.229 ± 0.014 | 2.158 ± 0.018 |
Most of the basic statistics you can see at this page can be downloaded from this CSV file
Proteome-pI is available under Creative Commons Attribution-NoDerivs license, for more details see here
| Reference: Kozlowski LP. Proteome-pI 2.0: Proteome Isoelectric Point Database Update. Nucleic Acids Res. 2021, doi: 10.1093/nar/gkab944 | Contact: Lukasz P. Kozlowski |
