Aquicella siphonis
Taxonomy: cellular organisms; Bacteria; Proteobacteria; Gammaproteobacteria; Legionellales; Coxiellaceae; Aquicella
Average proteome isoelectric point is 6.9
Get precalculated fractions of proteins
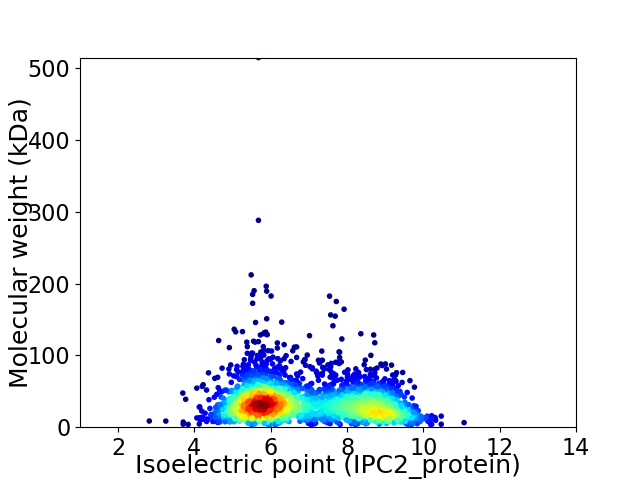
Virtual 2D-PAGE plot for 2580 proteins (isoelectric point calculated using IPC2_protein)
Get csv file with sequences according to given criteria:
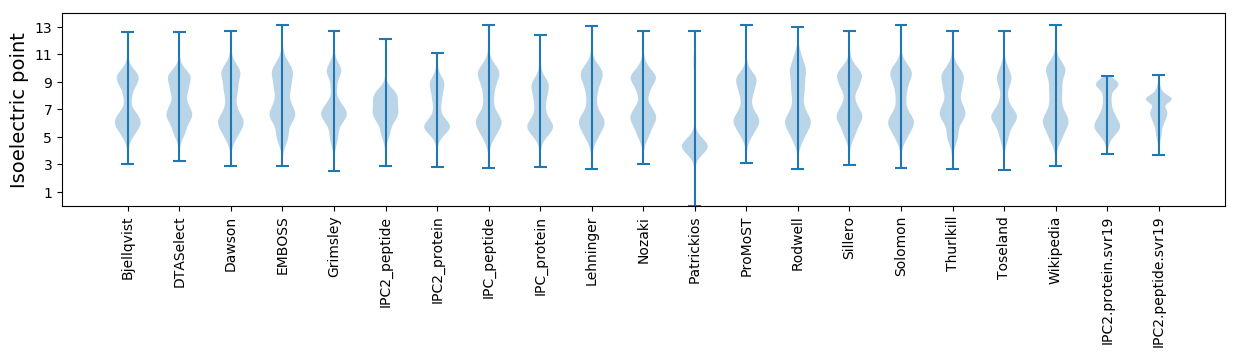
* You can choose from 21 different methods for calculating isoelectric point
Summary statistics related to proteome-wise predictions
Protein with the lowest isoelectric point:
>tr|A0A5E4PHL6|A0A5E4PHL6_9COXI Succinate dehydrogenase iron-sulfur subunit OS=Aquicella siphonis OX=254247 GN=sdhB PE=3 SV=1
MM1 pKa = 7.59PLEE4 pKa = 4.33IKK6 pKa = 10.58NIEE9 pKa = 4.12AADD12 pKa = 4.04GSNFAYY18 pKa = 10.4NDD20 pKa = 3.66RR21 pKa = 11.84VVMGAQFNLVNNSSPGAIASVAVDD45 pKa = 3.12AAGSYY50 pKa = 10.57EE51 pKa = 4.24SLPVIGTTGNGSGATLVAKK70 pKa = 9.85MKK72 pKa = 10.8ALTAVVAAAGTGYY85 pKa = 10.9LPGDD89 pKa = 4.53TITLTGGTFTTAAVMTIDD107 pKa = 3.38TSKK110 pKa = 10.86LVSAAVNAAGTGYY123 pKa = 11.04APTDD127 pKa = 3.78TITLAGGVATTAAVLSVATTKK148 pKa = 10.83LISAAVDD155 pKa = 3.65APGSGYY161 pKa = 10.97DD162 pKa = 3.45VADD165 pKa = 4.84TITLAGGAGATKK177 pKa = 10.49AVLTVDD183 pKa = 3.28NAQLVSVALDD193 pKa = 3.58AAGSGYY199 pKa = 11.14APGDD203 pKa = 3.92TITLAGGTAGTKK215 pKa = 10.36AVVTVDD221 pKa = 3.76TVSSGAIATFHH232 pKa = 6.79ISDD235 pKa = 3.75AGDD238 pKa = 3.51YY239 pKa = 9.04TVTATSFTQDD249 pKa = 3.11STSGAGTGATFDD261 pKa = 3.33TGLFGVLDD269 pKa = 4.08FTVSTAGSYY278 pKa = 6.57TTNAAAFTQDD288 pKa = 2.95STTGSGTGATFDD300 pKa = 3.45TTVFGVNTFTIANAGAYY317 pKa = 6.75QTNAASFTQAATSGAGTGATFNTTAYY343 pKa = 10.04GVNTFTISTAGSYY356 pKa = 10.63SVLPSDD362 pKa = 4.75PVAQGSTSGAGTGATFNINTWGLTAVTVSAGGTGYY397 pKa = 11.02DD398 pKa = 3.5SGSDD402 pKa = 3.37VTFTGGGGSGGAAATITLGSQAGNAVTVPVAFAANANLPAEE443 pKa = 4.33YY444 pKa = 10.36GVFVNPGQDD453 pKa = 3.39CRR455 pKa = 11.84WYY457 pKa = 10.95VDD459 pKa = 4.01NNSKK463 pKa = 8.23TATGFNVILTPVTGSDD479 pKa = 3.77VIAAGHH485 pKa = 6.53IDD487 pKa = 3.6VLLVGG492 pKa = 4.54
MM1 pKa = 7.59PLEE4 pKa = 4.33IKK6 pKa = 10.58NIEE9 pKa = 4.12AADD12 pKa = 4.04GSNFAYY18 pKa = 10.4NDD20 pKa = 3.66RR21 pKa = 11.84VVMGAQFNLVNNSSPGAIASVAVDD45 pKa = 3.12AAGSYY50 pKa = 10.57EE51 pKa = 4.24SLPVIGTTGNGSGATLVAKK70 pKa = 9.85MKK72 pKa = 10.8ALTAVVAAAGTGYY85 pKa = 10.9LPGDD89 pKa = 4.53TITLTGGTFTTAAVMTIDD107 pKa = 3.38TSKK110 pKa = 10.86LVSAAVNAAGTGYY123 pKa = 11.04APTDD127 pKa = 3.78TITLAGGVATTAAVLSVATTKK148 pKa = 10.83LISAAVDD155 pKa = 3.65APGSGYY161 pKa = 10.97DD162 pKa = 3.45VADD165 pKa = 4.84TITLAGGAGATKK177 pKa = 10.49AVLTVDD183 pKa = 3.28NAQLVSVALDD193 pKa = 3.58AAGSGYY199 pKa = 11.14APGDD203 pKa = 3.92TITLAGGTAGTKK215 pKa = 10.36AVVTVDD221 pKa = 3.76TVSSGAIATFHH232 pKa = 6.79ISDD235 pKa = 3.75AGDD238 pKa = 3.51YY239 pKa = 9.04TVTATSFTQDD249 pKa = 3.11STSGAGTGATFDD261 pKa = 3.33TGLFGVLDD269 pKa = 4.08FTVSTAGSYY278 pKa = 6.57TTNAAAFTQDD288 pKa = 2.95STTGSGTGATFDD300 pKa = 3.45TTVFGVNTFTIANAGAYY317 pKa = 6.75QTNAASFTQAATSGAGTGATFNTTAYY343 pKa = 10.04GVNTFTISTAGSYY356 pKa = 10.63SVLPSDD362 pKa = 4.75PVAQGSTSGAGTGATFNINTWGLTAVTVSAGGTGYY397 pKa = 11.02DD398 pKa = 3.5SGSDD402 pKa = 3.37VTFTGGGGSGGAAATITLGSQAGNAVTVPVAFAANANLPAEE443 pKa = 4.33YY444 pKa = 10.36GVFVNPGQDD453 pKa = 3.39CRR455 pKa = 11.84WYY457 pKa = 10.95VDD459 pKa = 4.01NNSKK463 pKa = 8.23TATGFNVILTPVTGSDD479 pKa = 3.77VIAAGHH485 pKa = 6.53IDD487 pKa = 3.6VLLVGG492 pKa = 4.54
Molecular weight: 47.57 kDa
Isoelectric point according different methods:
Protein with the highest isoelectric point:
>tr|A0A5E4PDT1|A0A5E4PDT1_9COXI Uncharacterized protein OS=Aquicella siphonis OX=254247 GN=AQUSIP_00170 PE=4 SV=1
MM1 pKa = 7.63AKK3 pKa = 10.43AKK5 pKa = 9.14TAAKK9 pKa = 10.03KK10 pKa = 10.21KK11 pKa = 8.59VAKK14 pKa = 9.29PRR16 pKa = 11.84KK17 pKa = 8.22KK18 pKa = 9.99AARR21 pKa = 11.84KK22 pKa = 7.25TKK24 pKa = 9.73VVKK27 pKa = 10.44AKK29 pKa = 10.43KK30 pKa = 9.59AVKK33 pKa = 8.87KK34 pKa = 6.63TTAKK38 pKa = 10.05KK39 pKa = 10.03RR40 pKa = 11.84SAGRR44 pKa = 11.84KK45 pKa = 7.34KK46 pKa = 10.46ARR48 pKa = 11.84PAAKK52 pKa = 9.68KK53 pKa = 10.23KK54 pKa = 10.21KK55 pKa = 9.27AAKK58 pKa = 9.74KK59 pKa = 10.07
MM1 pKa = 7.63AKK3 pKa = 10.43AKK5 pKa = 9.14TAAKK9 pKa = 10.03KK10 pKa = 10.21KK11 pKa = 8.59VAKK14 pKa = 9.29PRR16 pKa = 11.84KK17 pKa = 8.22KK18 pKa = 9.99AARR21 pKa = 11.84KK22 pKa = 7.25TKK24 pKa = 9.73VVKK27 pKa = 10.44AKK29 pKa = 10.43KK30 pKa = 9.59AVKK33 pKa = 8.87KK34 pKa = 6.63TTAKK38 pKa = 10.05KK39 pKa = 10.03RR40 pKa = 11.84SAGRR44 pKa = 11.84KK45 pKa = 7.34KK46 pKa = 10.46ARR48 pKa = 11.84PAAKK52 pKa = 9.68KK53 pKa = 10.23KK54 pKa = 10.21KK55 pKa = 9.27AAKK58 pKa = 9.74KK59 pKa = 10.07
Molecular weight: 6.41 kDa
Isoelectric point according different methods:
Peptides (in silico digests for buttom-up proteomics)
Below you can find in silico digests of the whole proteome with Trypsin, Chymotrypsin, Trypsin+LysC, LysN, ArgC proteases suitable for different mass spec machines.| Try ESI |
 |
|---|
| ChTry ESI |
|
|---|
| ArgC ESI |
|
|---|
| LysN ESI |
|
|---|
| TryLysC ESI |
|
|---|
| Try MALDI |
|
|---|
| ChTry MALDI |
|
|---|
| ArgC MALDI |
|
|---|
| LysN MALDI |
|
|---|
| TryLysC MALDI |
|
|---|
| Try LTQ |
|
|---|
| ChTry LTQ |
|
|---|
| ArgC LTQ |
|
|---|
| LysN LTQ |
|
|---|
| TryLysC LTQ |
|
|---|
| Try MSlow |
|
|---|
| ChTry MSlow |
|
|---|
| ArgC MSlow |
|
|---|
| LysN MSlow |
|
|---|
| TryLysC MSlow |
|
|---|
| Try MShigh |
|
|---|
| ChTry MShigh |
|
|---|
| ArgC MShigh |
|
|---|
| LysN MShigh |
|
|---|
| TryLysC MShigh |
|
|---|
General Statistics
Number of major isoforms |
Number of additional isoforms |
Number of all proteins |
Number of amino acids |
Min. Seq. Length |
Max. Seq. Length |
Avg. Seq. Length |
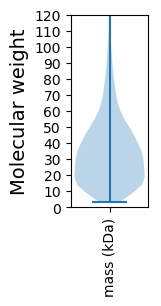
Avg. Mol. Weight |
|---|---|---|---|---|---|---|---|
0 |
845115 |
30 |
4636 |
327.6 |
36.59 |
Amino acid frequency
Ala |
Cys |
Asp |
Glu |
Phe |
Gly |
His |
Ile |
Lys |
Leu |
|---|---|---|---|---|---|---|---|---|---|
8.665 ± 0.05 | 1.142 ± 0.018 |
5.106 ± 0.033 | 5.614 ± 0.045 |
4.203 ± 0.033 | 6.49 ± 0.045 |
2.597 ± 0.024 | 6.96 ± 0.035 |
5.401 ± 0.046 | 10.43 ± 0.05 |
Met |
Asn |
Gln |
Pro |
Arg |
Ser |
Thr |
Val |
Trp |
Tyr |
|---|---|---|---|---|---|---|---|---|---|
2.686 ± 0.024 | 4.189 ± 0.033 |
4.402 ± 0.032 | 4.256 ± 0.035 |
5.294 ± 0.037 | 6.594 ± 0.043 |
5.199 ± 0.036 | 6.259 ± 0.04 |
1.129 ± 0.019 | 3.386 ± 0.032 |
Most of the basic statistics you can see at this page can be downloaded from this CSV file
See this proteome in:

Proteome-pI is available under Creative Commons Attribution-NoDerivs license, for more details see here
| Reference: Kozlowski LP. Proteome-pI 2.0: Proteome Isoelectric Point Database Update. Nucleic Acids Res. 2021, doi: 10.1093/nar/gkab944 | Contact: Lukasz P. Kozlowski |