Phragmitibacter flavus
Taxonomy: cellular organisms; Bacteria; PVC group; Verrucomicrobia; Verrucomicrobiae; Verrucomicrobiales; Verrucomicrobiaceae; Phragmitibacter
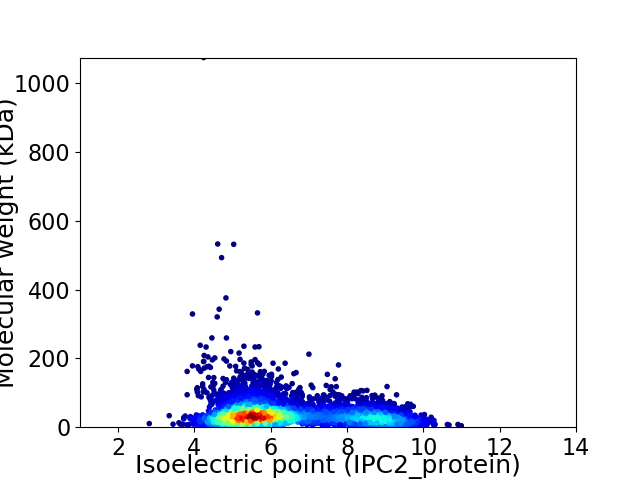
Average proteome isoelectric point is 6.44
Get precalculated fractions of proteins

Virtual 2D-PAGE plot for 4729 proteins (isoelectric point calculated using IPC2_protein)
Get csv file with sequences according to given criteria:
* You can choose from 21 different methods for calculating isoelectric point
Summary statistics related to proteome-wise predictions


Protein with the lowest isoelectric point:
>tr|A0A5R8K9V6|A0A5R8K9V6_9BACT Cytosolic protein OS=Phragmitibacter flavus OX=2576071 GN=FEM03_19405 PE=4 SV=1
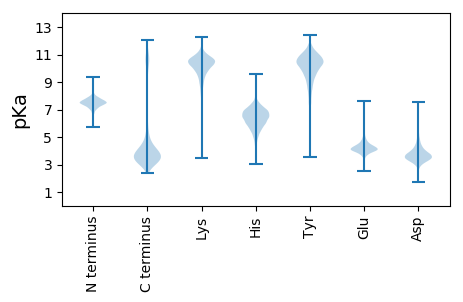
MM1 pKa = 7.48LGAGLSLDD9 pKa = 4.44LKK11 pKa = 10.52SQTVSLGTAEE21 pKa = 4.05NFAVLGATTVTNTGASVLNGDD42 pKa = 4.7LGVSPGTALTGFFAVDD58 pKa = 3.82GGPGVVNGSIYY69 pKa = 10.55SAGAEE74 pKa = 3.67ALQAQEE80 pKa = 4.31DD81 pKa = 4.28AEE83 pKa = 4.5DD84 pKa = 4.09AFDD87 pKa = 5.95AIAAMAFTTDD97 pKa = 3.35LTGQNLGGLTLTPGVYY113 pKa = 10.35HH114 pKa = 7.2FDD116 pKa = 3.22TSAQLTGNLTLDD128 pKa = 3.55GVGEE132 pKa = 4.47YY133 pKa = 9.93IFQIGSTLTTASNASITGINGADD156 pKa = 2.91ASQFFFNVGSSATLGTGTQFAGTILALTSITLTTGADD193 pKa = 2.88IDD195 pKa = 3.97YY196 pKa = 10.96GRR198 pKa = 11.84AIALNGAVTMDD209 pKa = 3.61TNFINAVPEE218 pKa = 4.16PSSALLVGGALIYY231 pKa = 10.72FGMFRR236 pKa = 11.84SRR238 pKa = 11.84HH239 pKa = 4.76SMGSS243 pKa = 3.12
MM1 pKa = 7.48LGAGLSLDD9 pKa = 4.44LKK11 pKa = 10.52SQTVSLGTAEE21 pKa = 4.05NFAVLGATTVTNTGASVLNGDD42 pKa = 4.7LGVSPGTALTGFFAVDD58 pKa = 3.82GGPGVVNGSIYY69 pKa = 10.55SAGAEE74 pKa = 3.67ALQAQEE80 pKa = 4.31DD81 pKa = 4.28AEE83 pKa = 4.5DD84 pKa = 4.09AFDD87 pKa = 5.95AIAAMAFTTDD97 pKa = 3.35LTGQNLGGLTLTPGVYY113 pKa = 10.35HH114 pKa = 7.2FDD116 pKa = 3.22TSAQLTGNLTLDD128 pKa = 3.55GVGEE132 pKa = 4.47YY133 pKa = 9.93IFQIGSTLTTASNASITGINGADD156 pKa = 2.91ASQFFFNVGSSATLGTGTQFAGTILALTSITLTTGADD193 pKa = 2.88IDD195 pKa = 3.97YY196 pKa = 10.96GRR198 pKa = 11.84AIALNGAVTMDD209 pKa = 3.61TNFINAVPEE218 pKa = 4.16PSSALLVGGALIYY231 pKa = 10.72FGMFRR236 pKa = 11.84SRR238 pKa = 11.84HH239 pKa = 4.76SMGSS243 pKa = 3.12
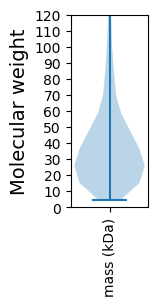
Molecular weight: 24.31 kDa
Isoelectric point according different methods:
Protein with the highest isoelectric point:
>tr|A0A5R8KEY2|A0A5R8KEY2_9BACT Uncharacterized protein OS=Phragmitibacter flavus OX=2576071 GN=FEM03_11190 PE=4 SV=1
MM1 pKa = 7.9PMPAIDD7 pKa = 3.6TTATAFFAGLVTSLHH22 pKa = 5.99CVGMCGPMACAWAGKK37 pKa = 10.13ASSQKK42 pKa = 8.0PTPFIRR48 pKa = 11.84DD49 pKa = 3.27TTLYY53 pKa = 10.04HH54 pKa = 7.01AARR57 pKa = 11.84LLSYY61 pKa = 9.17TVIGAIAGTIGIMPMQWFQHH81 pKa = 5.17GPALILPWLLVGLFIIIAFGLEE103 pKa = 3.34RR104 pKa = 11.84WLPKK108 pKa = 10.07PRR110 pKa = 11.84FLTMPMARR118 pKa = 11.84LKK120 pKa = 10.55LWALRR125 pKa = 11.84RR126 pKa = 11.84PPFHH130 pKa = 6.79RR131 pKa = 11.84AIIIGLATPLIPCGPLYY148 pKa = 11.18LMLGLAVANGSTIGGASFALAFGFGTLPLLWLMQTQLQWLNLKK191 pKa = 7.8LTPVRR196 pKa = 11.84LRR198 pKa = 11.84QVQRR202 pKa = 11.84SLALLAVFIMIWRR215 pKa = 11.84LRR217 pKa = 11.84GTFTGEE223 pKa = 3.88PDD225 pKa = 3.66TSCCHH230 pKa = 6.59PSLITGVPQQ239 pKa = 3.59
MM1 pKa = 7.9PMPAIDD7 pKa = 3.6TTATAFFAGLVTSLHH22 pKa = 5.99CVGMCGPMACAWAGKK37 pKa = 10.13ASSQKK42 pKa = 8.0PTPFIRR48 pKa = 11.84DD49 pKa = 3.27TTLYY53 pKa = 10.04HH54 pKa = 7.01AARR57 pKa = 11.84LLSYY61 pKa = 9.17TVIGAIAGTIGIMPMQWFQHH81 pKa = 5.17GPALILPWLLVGLFIIIAFGLEE103 pKa = 3.34RR104 pKa = 11.84WLPKK108 pKa = 10.07PRR110 pKa = 11.84FLTMPMARR118 pKa = 11.84LKK120 pKa = 10.55LWALRR125 pKa = 11.84RR126 pKa = 11.84PPFHH130 pKa = 6.79RR131 pKa = 11.84AIIIGLATPLIPCGPLYY148 pKa = 11.18LMLGLAVANGSTIGGASFALAFGFGTLPLLWLMQTQLQWLNLKK191 pKa = 7.8LTPVRR196 pKa = 11.84LRR198 pKa = 11.84QVQRR202 pKa = 11.84SLALLAVFIMIWRR215 pKa = 11.84LRR217 pKa = 11.84GTFTGEE223 pKa = 3.88PDD225 pKa = 3.66TSCCHH230 pKa = 6.59PSLITGVPQQ239 pKa = 3.59
Molecular weight: 26.15 kDa
Isoelectric point according different methods:
Peptides (in silico digests for buttom-up proteomics)
Below you can find in silico digests of the whole proteome with Trypsin, Chymotrypsin, Trypsin+LysC, LysN, ArgC proteases suitable for different mass spec machines.| Try ESI |
 |
|---|
| ChTry ESI |
 |
|---|
| ArgC ESI |
 |
|---|
| LysN ESI |
 |
|---|
| TryLysC ESI |
 |
|---|
| Try MALDI |
 |
|---|
| ChTry MALDI |
 |
|---|
| ArgC MALDI |
 |
|---|
| LysN MALDI |
 |
|---|
| TryLysC MALDI |
 |
|---|
| Try LTQ |
 |
|---|
| ChTry LTQ |
 |
|---|
| ArgC LTQ |
 |
|---|
| LysN LTQ |
 |
|---|
| TryLysC LTQ |
 |
|---|
| Try MSlow |
 |
|---|
| ChTry MSlow |
 |
|---|
| ArgC MSlow |
 |
|---|
| LysN MSlow |
 |
|---|
| TryLysC MSlow |
 |
|---|
| Try MShigh |
 |
|---|
| ChTry MShigh |
 |
|---|
| ArgC MShigh |
 |
|---|
| LysN MShigh |
 |
|---|
| TryLysC MShigh |
 |
|---|
General Statistics
Number of major isoforms |
Number of additional isoforms |
Number of all proteins |
Number of amino acids |
Min. Seq. Length |
Max. Seq. Length |
Avg. Seq. Length |
Avg. Mol. Weight |
|---|---|---|---|---|---|---|---|
0 |
1763432 |
34 |
10561 |
372.9 |
40.99 |
Amino acid frequency
Ala |
Cys |
Asp |
Glu |
Phe |
Gly |
His |
Ile |
Lys |
Leu |
|---|---|---|---|---|---|---|---|---|---|
9.594 ± 0.033 | 0.89 ± 0.014 |
5.343 ± 0.028 | 6.039 ± 0.055 |
4.006 ± 0.02 | 8.131 ± 0.075 |
2.345 ± 0.025 | 5.092 ± 0.034 |
4.292 ± 0.046 | 10.318 ± 0.049 |
Met |
Asn |
Gln |
Pro |
Arg |
Ser |
Thr |
Val |
Trp |
Tyr |
|---|---|---|---|---|---|---|---|---|---|
2.349 ± 0.023 | 3.647 ± 0.053 |
5.173 ± 0.041 | 3.69 ± 0.025 |
5.939 ± 0.046 | 6.252 ± 0.04 |
5.989 ± 0.074 | 6.947 ± 0.04 |
1.613 ± 0.019 | 2.35 ± 0.016 |
Most of the basic statistics you can see at this page can be downloaded from this CSV file
Proteome-pI is available under Creative Commons Attribution-NoDerivs license, for more details see here
| Reference: Kozlowski LP. Proteome-pI 2.0: Proteome Isoelectric Point Database Update. Nucleic Acids Res. 2021, doi: 10.1093/nar/gkab944 | Contact: Lukasz P. Kozlowski |
