Fusibacter sp. 3D3
Taxonomy: cellular organisms; Bacteria; Terrabacteria group; Firmicutes; Clostridia; Eubacteriales; Eubacteriales incertae sedis; Eubacteriales Family XII. Incertae Sedis; Fusibacter; unclassified Fusibacter
Average proteome isoelectric point is 6.23
Get precalculated fractions of proteins

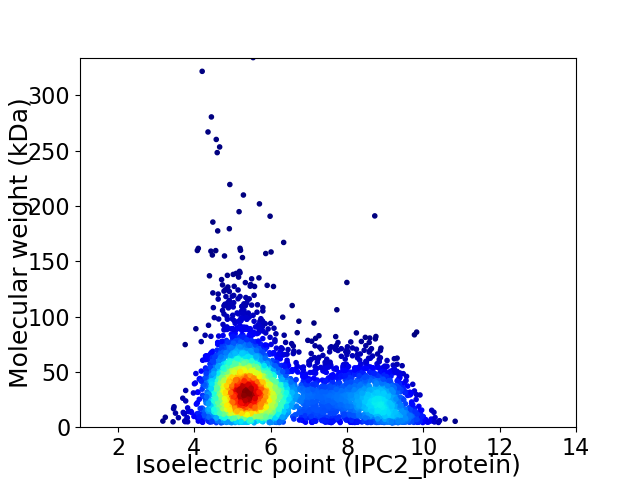
Virtual 2D-PAGE plot for 4633 proteins (isoelectric point calculated using IPC2_protein)
Get csv file with sequences according to given criteria:
* You can choose from 21 different methods for calculating isoelectric point
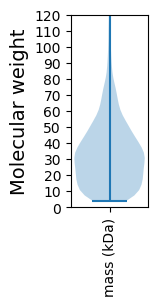
Summary statistics related to proteome-wise predictions


Protein with the lowest isoelectric point:
>tr|A0A1B6BE14|A0A1B6BE14_9FIRM Uncharacterized protein OS=Fusibacter sp. 3D3 OX=1048380 GN=F3D3_2584 PE=4 SV=1
MM1 pKa = 7.16SRR3 pKa = 11.84KK4 pKa = 9.47ILVLTFLFALLLITACSNSEE24 pKa = 3.97IEE26 pKa = 4.14TPIQVEE32 pKa = 4.57EE33 pKa = 4.28PSEE36 pKa = 4.07GTPATTASTDD46 pKa = 3.69EE47 pKa = 4.48IEE49 pKa = 4.67SSNTNEE55 pKa = 4.28APQDD59 pKa = 3.54SDD61 pKa = 3.69SATEE65 pKa = 3.99SSSAQQEE72 pKa = 4.15PYY74 pKa = 9.61IWEE77 pKa = 4.27DD78 pKa = 3.77FEE80 pKa = 6.03LKK82 pKa = 10.86NLDD85 pKa = 3.33GTTAQLYY92 pKa = 9.94DD93 pKa = 4.13FKK95 pKa = 11.68DD96 pKa = 3.75KK97 pKa = 10.94IVVINFWATWCHH109 pKa = 6.14FCDD112 pKa = 4.11QEE114 pKa = 4.22MPLIEE119 pKa = 5.76ALSQDD124 pKa = 3.88DD125 pKa = 4.59KK126 pKa = 11.46YY127 pKa = 11.39QVLAINVGEE136 pKa = 4.35DD137 pKa = 2.9TDD139 pKa = 4.58TIQKK143 pKa = 10.35YY144 pKa = 10.47LDD146 pKa = 3.63EE147 pKa = 6.01KK148 pKa = 11.02GLSLNVYY155 pKa = 10.11LDD157 pKa = 3.88EE158 pKa = 4.89DD159 pKa = 3.6QSLAGQFSVTGFPTTVFLGPNAEE182 pKa = 4.06YY183 pKa = 10.48LYY185 pKa = 10.03AYY187 pKa = 9.76PGMLDD192 pKa = 3.2QKK194 pKa = 9.6TLDD197 pKa = 4.54SILASIDD204 pKa = 3.34EE205 pKa = 4.29YY206 pKa = 11.28LAQSVLKK213 pKa = 10.77
MM1 pKa = 7.16SRR3 pKa = 11.84KK4 pKa = 9.47ILVLTFLFALLLITACSNSEE24 pKa = 3.97IEE26 pKa = 4.14TPIQVEE32 pKa = 4.57EE33 pKa = 4.28PSEE36 pKa = 4.07GTPATTASTDD46 pKa = 3.69EE47 pKa = 4.48IEE49 pKa = 4.67SSNTNEE55 pKa = 4.28APQDD59 pKa = 3.54SDD61 pKa = 3.69SATEE65 pKa = 3.99SSSAQQEE72 pKa = 4.15PYY74 pKa = 9.61IWEE77 pKa = 4.27DD78 pKa = 3.77FEE80 pKa = 6.03LKK82 pKa = 10.86NLDD85 pKa = 3.33GTTAQLYY92 pKa = 9.94DD93 pKa = 4.13FKK95 pKa = 11.68DD96 pKa = 3.75KK97 pKa = 10.94IVVINFWATWCHH109 pKa = 6.14FCDD112 pKa = 4.11QEE114 pKa = 4.22MPLIEE119 pKa = 5.76ALSQDD124 pKa = 3.88DD125 pKa = 4.59KK126 pKa = 11.46YY127 pKa = 11.39QVLAINVGEE136 pKa = 4.35DD137 pKa = 2.9TDD139 pKa = 4.58TIQKK143 pKa = 10.35YY144 pKa = 10.47LDD146 pKa = 3.63EE147 pKa = 6.01KK148 pKa = 11.02GLSLNVYY155 pKa = 10.11LDD157 pKa = 3.88EE158 pKa = 4.89DD159 pKa = 3.6QSLAGQFSVTGFPTTVFLGPNAEE182 pKa = 4.06YY183 pKa = 10.48LYY185 pKa = 10.03AYY187 pKa = 9.76PGMLDD192 pKa = 3.2QKK194 pKa = 9.6TLDD197 pKa = 4.54SILASIDD204 pKa = 3.34EE205 pKa = 4.29YY206 pKa = 11.28LAQSVLKK213 pKa = 10.77
Molecular weight: 23.74 kDa
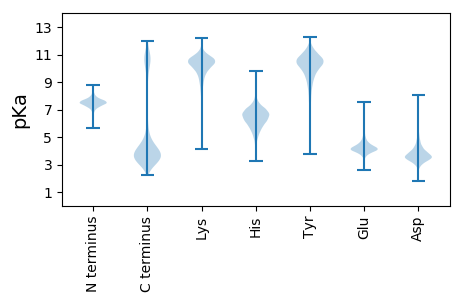
Isoelectric point according different methods:
Protein with the highest isoelectric point:
>tr|A0A1B6B7T8|A0A1B6B7T8_9FIRM Accessory gene regulator B OS=Fusibacter sp. 3D3 OX=1048380 GN=F3D3_0414 PE=4 SV=1
MM1 pKa = 7.31KK2 pKa = 9.52QTFQPKK8 pKa = 8.5KK9 pKa = 7.54RR10 pKa = 11.84QRR12 pKa = 11.84KK13 pKa = 7.92VEE15 pKa = 3.7HH16 pKa = 6.38GFRR19 pKa = 11.84KK20 pKa = 9.77RR21 pKa = 11.84MKK23 pKa = 10.02SSSGRR28 pKa = 11.84NILKK32 pKa = 9.76SRR34 pKa = 11.84RR35 pKa = 11.84RR36 pKa = 11.84KK37 pKa = 9.4GRR39 pKa = 11.84KK40 pKa = 8.87KK41 pKa = 10.58LSAA44 pKa = 3.95
MM1 pKa = 7.31KK2 pKa = 9.52QTFQPKK8 pKa = 8.5KK9 pKa = 7.54RR10 pKa = 11.84QRR12 pKa = 11.84KK13 pKa = 7.92VEE15 pKa = 3.7HH16 pKa = 6.38GFRR19 pKa = 11.84KK20 pKa = 9.77RR21 pKa = 11.84MKK23 pKa = 10.02SSSGRR28 pKa = 11.84NILKK32 pKa = 9.76SRR34 pKa = 11.84RR35 pKa = 11.84RR36 pKa = 11.84KK37 pKa = 9.4GRR39 pKa = 11.84KK40 pKa = 8.87KK41 pKa = 10.58LSAA44 pKa = 3.95
Molecular weight: 5.34 kDa
Isoelectric point according different methods:
Peptides (in silico digests for buttom-up proteomics)
Below you can find in silico digests of the whole proteome with Trypsin, Chymotrypsin, Trypsin+LysC, LysN, ArgC proteases suitable for different mass spec machines.| Try ESI |
 |
|---|
| ChTry ESI |
 |
|---|
| ArgC ESI |
 |
|---|
| LysN ESI |
 |
|---|
| TryLysC ESI |
 |
|---|
| Try MALDI |
 |
|---|
| ChTry MALDI |
 |
|---|
| ArgC MALDI |
 |
|---|
| LysN MALDI |
 |
|---|
| TryLysC MALDI |
 |
|---|
| Try LTQ |
 |
|---|
| ChTry LTQ |
 |
|---|
| ArgC LTQ |
 |
|---|
| LysN LTQ |
 |
|---|
| TryLysC LTQ |
 |
|---|
| Try MSlow |
 |
|---|
| ChTry MSlow |
 |
|---|
| ArgC MSlow |
 |
|---|
| LysN MSlow |
 |
|---|
| TryLysC MSlow |
 |
|---|
| Try MShigh |
 |
|---|
| ChTry MShigh |
 |
|---|
| ArgC MShigh |
 |
|---|
| LysN MShigh |
 |
|---|
| TryLysC MShigh |
 |
|---|
General Statistics
Number of major isoforms |
Number of additional isoforms |
Number of all proteins |
Number of amino acids |
Min. Seq. Length |
Max. Seq. Length |
Avg. Seq. Length |
Avg. Mol. Weight |
|---|---|---|---|---|---|---|---|
0 |
1463251 |
37 |
2939 |
315.8 |
35.52 |
Amino acid frequency
Ala |
Cys |
Asp |
Glu |
Phe |
Gly |
His |
Ile |
Lys |
Leu |
|---|---|---|---|---|---|---|---|---|---|
6.704 ± 0.04 | 0.984 ± 0.011 |
5.441 ± 0.027 | 7.121 ± 0.038 |
4.511 ± 0.028 | 6.398 ± 0.037 |
1.959 ± 0.017 | 8.809 ± 0.037 |
7.336 ± 0.037 | 9.681 ± 0.04 |
Met |
Asn |
Gln |
Pro |
Arg |
Ser |
Thr |
Val |
Trp |
Tyr |
|---|---|---|---|---|---|---|---|---|---|
2.978 ± 0.018 | 4.906 ± 0.029 |
3.124 ± 0.021 | 3.171 ± 0.021 |
3.587 ± 0.026 | 6.394 ± 0.031 |
5.447 ± 0.046 | 6.664 ± 0.027 |
0.762 ± 0.012 | 4.015 ± 0.026 |
Most of the basic statistics you can see at this page can be downloaded from this CSV file
Proteome-pI is available under Creative Commons Attribution-NoDerivs license, for more details see here
| Reference: Kozlowski LP. Proteome-pI 2.0: Proteome Isoelectric Point Database Update. Nucleic Acids Res. 2021, doi: 10.1093/nar/gkab944 | Contact: Lukasz P. Kozlowski |
