Pedobacter nutrimenti
Taxonomy: cellular organisms; Bacteria; FCB group; Bacteroidetes/Chlorobi group; Bacteroidetes; Sphingobacteriia; Sphingobacteriales; Sphingobacteriaceae; Pedobacter
Average proteome isoelectric point is 7.16
Get precalculated fractions of proteins

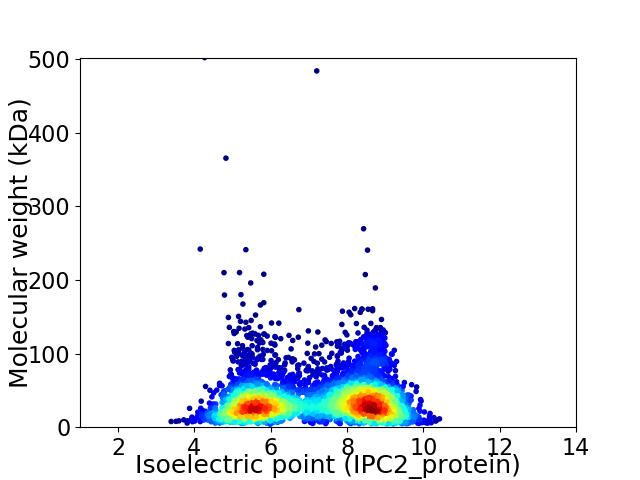
Virtual 2D-PAGE plot for 4924 proteins (isoelectric point calculated using IPC2_protein)
Get csv file with sequences according to given criteria:
* You can choose from 21 different methods for calculating isoelectric point
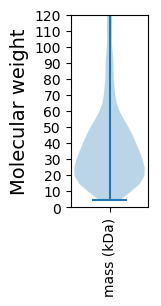
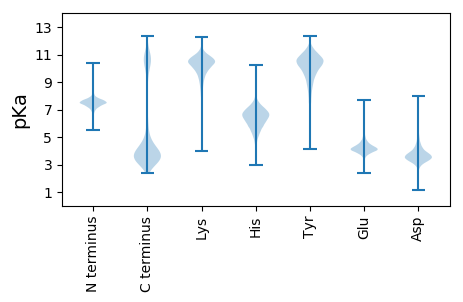
Summary statistics related to proteome-wise predictions


Protein with the lowest isoelectric point:
>tr|A0A318UGF7|A0A318UGF7_9SPHI Acetyltransferase (GNAT) family protein OS=Pedobacter nutrimenti OX=1241337 GN=B0O44_10315 PE=4 SV=1
MM1 pKa = 7.59LSYY4 pKa = 9.78MQIIPPMDD12 pKa = 5.18DD13 pKa = 3.98DD14 pKa = 5.67KK15 pKa = 11.52MDD17 pKa = 3.52GVLFIAALPVFYY29 pKa = 10.08FIIAQTAKK37 pKa = 9.67RR38 pKa = 11.84CHH40 pKa = 6.52DD41 pKa = 4.22RR42 pKa = 11.84GDD44 pKa = 3.81SGWWMIVPLYY54 pKa = 9.51GFWMLFADD62 pKa = 5.49GDD64 pKa = 3.91IGDD67 pKa = 4.57NEE69 pKa = 4.42YY70 pKa = 11.31GPNPKK75 pKa = 10.05GLYY78 pKa = 10.07YY79 pKa = 10.47EE80 pKa = 5.37FEE82 pKa = 4.49DD83 pKa = 4.35HH84 pKa = 6.96NSPSPIDD91 pKa = 3.59QVDD94 pKa = 3.16GDD96 pKa = 3.93GRR98 pKa = 11.84III100 pKa = 4.09
MM1 pKa = 7.59LSYY4 pKa = 9.78MQIIPPMDD12 pKa = 5.18DD13 pKa = 3.98DD14 pKa = 5.67KK15 pKa = 11.52MDD17 pKa = 3.52GVLFIAALPVFYY29 pKa = 10.08FIIAQTAKK37 pKa = 9.67RR38 pKa = 11.84CHH40 pKa = 6.52DD41 pKa = 4.22RR42 pKa = 11.84GDD44 pKa = 3.81SGWWMIVPLYY54 pKa = 9.51GFWMLFADD62 pKa = 5.49GDD64 pKa = 3.91IGDD67 pKa = 4.57NEE69 pKa = 4.42YY70 pKa = 11.31GPNPKK75 pKa = 10.05GLYY78 pKa = 10.07YY79 pKa = 10.47EE80 pKa = 5.37FEE82 pKa = 4.49DD83 pKa = 4.35HH84 pKa = 6.96NSPSPIDD91 pKa = 3.59QVDD94 pKa = 3.16GDD96 pKa = 3.93GRR98 pKa = 11.84III100 pKa = 4.09
Molecular weight: 11.43 kDa
Isoelectric point according different methods:
Protein with the highest isoelectric point:
>tr|A0A318U6F1|A0A318U6F1_9SPHI Uncharacterized protein OS=Pedobacter nutrimenti OX=1241337 GN=B0O44_11214 PE=4 SV=1
MM1 pKa = 7.78SDD3 pKa = 2.66GHH5 pKa = 6.55LAFMIGLLGSVHH17 pKa = 7.11CIGMCGPLAFAVPSVKK33 pKa = 9.64TGRR36 pKa = 11.84VYY38 pKa = 11.39LFTDD42 pKa = 3.26KK43 pKa = 11.0VLYY46 pKa = 10.12QLGRR50 pKa = 11.84MISYY54 pKa = 10.23SVLGACIGGIGRR66 pKa = 11.84QLWLSGLQQGISVASGLLILAAACSRR92 pKa = 11.84IFKK95 pKa = 10.51LSGVNRR101 pKa = 11.84TPAFLLQPFHH111 pKa = 7.13RR112 pKa = 11.84LLGAALKK119 pKa = 10.51HH120 pKa = 5.82KK121 pKa = 10.31ANHH124 pKa = 6.58LIIGIINGLLPCGFVYY140 pKa = 10.51LALAGAVNTGSIPAASAYY158 pKa = 7.8MFWFGAGTAPLMLLATIGVGFSGKK182 pKa = 7.56VLRR185 pKa = 11.84GRR187 pKa = 11.84INRR190 pKa = 11.84MVPYY194 pKa = 10.93LMLFLGIWFILRR206 pKa = 11.84GMDD209 pKa = 4.23LNIPYY214 pKa = 10.17LSPSKK219 pKa = 10.05PSSGVAEE226 pKa = 4.4CRR228 pKa = 3.51
MM1 pKa = 7.78SDD3 pKa = 2.66GHH5 pKa = 6.55LAFMIGLLGSVHH17 pKa = 7.11CIGMCGPLAFAVPSVKK33 pKa = 9.64TGRR36 pKa = 11.84VYY38 pKa = 11.39LFTDD42 pKa = 3.26KK43 pKa = 11.0VLYY46 pKa = 10.12QLGRR50 pKa = 11.84MISYY54 pKa = 10.23SVLGACIGGIGRR66 pKa = 11.84QLWLSGLQQGISVASGLLILAAACSRR92 pKa = 11.84IFKK95 pKa = 10.51LSGVNRR101 pKa = 11.84TPAFLLQPFHH111 pKa = 7.13RR112 pKa = 11.84LLGAALKK119 pKa = 10.51HH120 pKa = 5.82KK121 pKa = 10.31ANHH124 pKa = 6.58LIIGIINGLLPCGFVYY140 pKa = 10.51LALAGAVNTGSIPAASAYY158 pKa = 7.8MFWFGAGTAPLMLLATIGVGFSGKK182 pKa = 7.56VLRR185 pKa = 11.84GRR187 pKa = 11.84INRR190 pKa = 11.84MVPYY194 pKa = 10.93LMLFLGIWFILRR206 pKa = 11.84GMDD209 pKa = 4.23LNIPYY214 pKa = 10.17LSPSKK219 pKa = 10.05PSSGVAEE226 pKa = 4.4CRR228 pKa = 3.51
Molecular weight: 24.2 kDa
Isoelectric point according different methods:
Peptides (in silico digests for buttom-up proteomics)
Below you can find in silico digests of the whole proteome with Trypsin, Chymotrypsin, Trypsin+LysC, LysN, ArgC proteases suitable for different mass spec machines.| Try ESI |
 |
|---|
| ChTry ESI |
 |
|---|
| ArgC ESI |
 |
|---|
| LysN ESI |
 |
|---|
| TryLysC ESI |
 |
|---|
| Try MALDI |
 |
|---|
| ChTry MALDI |
 |
|---|
| ArgC MALDI |
 |
|---|
| LysN MALDI |
 |
|---|
| TryLysC MALDI |
 |
|---|
| Try LTQ |
 |
|---|
| ChTry LTQ |
 |
|---|
| ArgC LTQ |
 |
|---|
| LysN LTQ |
 |
|---|
| TryLysC LTQ |
 |
|---|
| Try MSlow |
 |
|---|
| ChTry MSlow |
 |
|---|
| ArgC MSlow |
 |
|---|
| LysN MSlow |
 |
|---|
| TryLysC MSlow |
 |
|---|
| Try MShigh |
 |
|---|
| ChTry MShigh |
 |
|---|
| ArgC MShigh |
 |
|---|
| LysN MShigh |
 |
|---|
| TryLysC MShigh |
 |
|---|
General Statistics
Number of major isoforms |
Number of additional isoforms |
Number of all proteins |
Number of amino acids |
Min. Seq. Length |
Max. Seq. Length |
Avg. Seq. Length |
Avg. Mol. Weight |
|---|---|---|---|---|---|---|---|
0 |
1744692 |
39 |
5029 |
354.3 |
39.71 |
Amino acid frequency
Ala |
Cys |
Asp |
Glu |
Phe |
Gly |
His |
Ile |
Lys |
Leu |
|---|---|---|---|---|---|---|---|---|---|
7.404 ± 0.037 | 0.729 ± 0.01 |
5.031 ± 0.019 | 5.609 ± 0.039 |
4.992 ± 0.027 | 6.888 ± 0.036 |
1.758 ± 0.018 | 6.929 ± 0.035 |
7.387 ± 0.04 | 10.02 ± 0.042 |
Met |
Asn |
Gln |
Pro |
Arg |
Ser |
Thr |
Val |
Trp |
Tyr |
|---|---|---|---|---|---|---|---|---|---|
2.255 ± 0.015 | 5.568 ± 0.036 |
3.795 ± 0.022 | 3.991 ± 0.023 |
3.84 ± 0.024 | 6.713 ± 0.031 |
5.574 ± 0.051 | 6.236 ± 0.028 |
1.112 ± 0.013 | 4.17 ± 0.024 |
Most of the basic statistics you can see at this page can be downloaded from this CSV file
Proteome-pI is available under Creative Commons Attribution-NoDerivs license, for more details see here
| Reference: Kozlowski LP. Proteome-pI 2.0: Proteome Isoelectric Point Database Update. Nucleic Acids Res. 2021, doi: 10.1093/nar/gkab944 | Contact: Lukasz P. Kozlowski |
