Nocardioides guangzhouensis
Taxonomy: cellular organisms; Bacteria; Terrabacteria group; Actinobacteria; Actinomycetia; Propionibacteriales; Nocardioidaceae; Nocardioides
Average proteome isoelectric point is 5.97
Get precalculated fractions of proteins

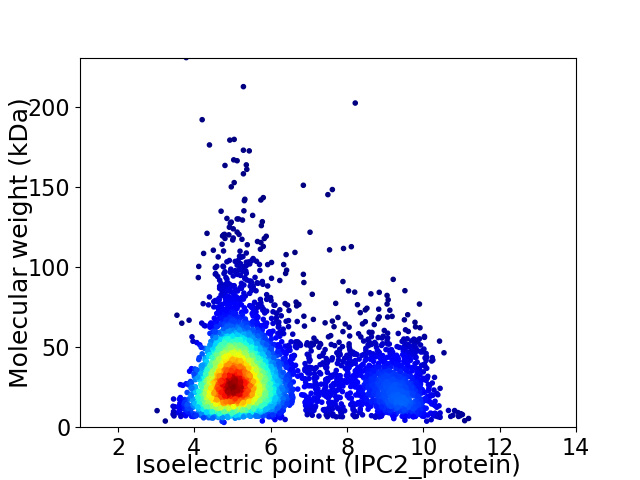
Virtual 2D-PAGE plot for 4817 proteins (isoelectric point calculated using IPC2_protein)
Get csv file with sequences according to given criteria:
* You can choose from 21 different methods for calculating isoelectric point
Summary statistics related to proteome-wise predictions


Protein with the lowest isoelectric point:
>tr|A0A4V1XZ50|A0A4V1XZ50_9ACTN Response regulator transcription factor OS=Nocardioides guangzhouensis OX=2497878 GN=EKO23_12210 PE=4 SV=1
MM1 pKa = 7.32STRR4 pKa = 11.84QHH6 pKa = 5.93FAWAAAIAAAAILTPAPASAAPPSNDD32 pKa = 4.0TIDD35 pKa = 3.79GAISASVGFSQVLDD49 pKa = 3.7TTEE52 pKa = 3.95ATTDD56 pKa = 3.48EE57 pKa = 4.54QDD59 pKa = 3.3TQFNEE64 pKa = 4.28TCGAPATDD72 pKa = 3.1ASVWYY77 pKa = 8.12TVAGTGAGVVVDD89 pKa = 5.49VSASSYY95 pKa = 10.21SAGVMVGTGTPDD107 pKa = 3.12NLEE110 pKa = 4.19TVACGPGTVGFLAEE124 pKa = 4.99AGTTYY129 pKa = 10.98YY130 pKa = 11.23VLAFDD135 pKa = 4.62DD136 pKa = 4.43QEE138 pKa = 6.55DD139 pKa = 4.32GTGTGGSLDD148 pKa = 3.32ISFAAAPPPPTAEE161 pKa = 3.69ITVDD165 pKa = 3.27PRR167 pKa = 11.84GTFSSKK173 pKa = 9.73TGIAHH178 pKa = 7.6LSGSYY183 pKa = 9.41TCTDD187 pKa = 3.24ADD189 pKa = 3.82FLEE192 pKa = 4.65VDD194 pKa = 3.92GSVRR198 pKa = 11.84QPVGRR203 pKa = 11.84LAVTGSFFVFDD214 pKa = 4.77EE215 pKa = 5.01GTCDD219 pKa = 3.75GTPHH223 pKa = 6.87PWAADD228 pKa = 3.51VEE230 pKa = 4.3PDD232 pKa = 3.12NGKK235 pKa = 9.54FAGGKK240 pKa = 10.28AMTVTFTFACGPFDD254 pKa = 3.76CAEE257 pKa = 4.27GFAEE261 pKa = 4.25QTVHH265 pKa = 7.36LSGGKK270 pKa = 9.32KK271 pKa = 9.81
MM1 pKa = 7.32STRR4 pKa = 11.84QHH6 pKa = 5.93FAWAAAIAAAAILTPAPASAAPPSNDD32 pKa = 4.0TIDD35 pKa = 3.79GAISASVGFSQVLDD49 pKa = 3.7TTEE52 pKa = 3.95ATTDD56 pKa = 3.48EE57 pKa = 4.54QDD59 pKa = 3.3TQFNEE64 pKa = 4.28TCGAPATDD72 pKa = 3.1ASVWYY77 pKa = 8.12TVAGTGAGVVVDD89 pKa = 5.49VSASSYY95 pKa = 10.21SAGVMVGTGTPDD107 pKa = 3.12NLEE110 pKa = 4.19TVACGPGTVGFLAEE124 pKa = 4.99AGTTYY129 pKa = 10.98YY130 pKa = 11.23VLAFDD135 pKa = 4.62DD136 pKa = 4.43QEE138 pKa = 6.55DD139 pKa = 4.32GTGTGGSLDD148 pKa = 3.32ISFAAAPPPPTAEE161 pKa = 3.69ITVDD165 pKa = 3.27PRR167 pKa = 11.84GTFSSKK173 pKa = 9.73TGIAHH178 pKa = 7.6LSGSYY183 pKa = 9.41TCTDD187 pKa = 3.24ADD189 pKa = 3.82FLEE192 pKa = 4.65VDD194 pKa = 3.92GSVRR198 pKa = 11.84QPVGRR203 pKa = 11.84LAVTGSFFVFDD214 pKa = 4.77EE215 pKa = 5.01GTCDD219 pKa = 3.75GTPHH223 pKa = 6.87PWAADD228 pKa = 3.51VEE230 pKa = 4.3PDD232 pKa = 3.12NGKK235 pKa = 9.54FAGGKK240 pKa = 10.28AMTVTFTFACGPFDD254 pKa = 3.76CAEE257 pKa = 4.27GFAEE261 pKa = 4.25QTVHH265 pKa = 7.36LSGGKK270 pKa = 9.32KK271 pKa = 9.81
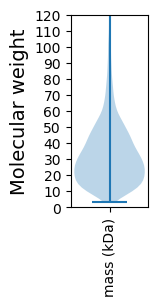
Molecular weight: 27.4 kDa
Isoelectric point according different methods:
Protein with the highest isoelectric point:
>tr|A0A4Q4ZKN6|A0A4Q4ZKN6_9ACTN Transcriptional regulator OS=Nocardioides guangzhouensis OX=2497878 GN=EKO23_00380 PE=4 SV=1
MM1 pKa = 7.4GSVIKK6 pKa = 10.42KK7 pKa = 8.47RR8 pKa = 11.84RR9 pKa = 11.84KK10 pKa = 9.22RR11 pKa = 11.84MAKK14 pKa = 9.41KK15 pKa = 9.99KK16 pKa = 9.77HH17 pKa = 5.81RR18 pKa = 11.84KK19 pKa = 8.51LLKK22 pKa = 8.15KK23 pKa = 9.24TRR25 pKa = 11.84VQRR28 pKa = 11.84RR29 pKa = 11.84KK30 pKa = 10.07LGKK33 pKa = 9.87
MM1 pKa = 7.4GSVIKK6 pKa = 10.42KK7 pKa = 8.47RR8 pKa = 11.84RR9 pKa = 11.84KK10 pKa = 9.22RR11 pKa = 11.84MAKK14 pKa = 9.41KK15 pKa = 9.99KK16 pKa = 9.77HH17 pKa = 5.81RR18 pKa = 11.84KK19 pKa = 8.51LLKK22 pKa = 8.15KK23 pKa = 9.24TRR25 pKa = 11.84VQRR28 pKa = 11.84RR29 pKa = 11.84KK30 pKa = 10.07LGKK33 pKa = 9.87
Molecular weight: 4.07 kDa
Isoelectric point according different methods:
Peptides (in silico digests for buttom-up proteomics)
Below you can find in silico digests of the whole proteome with Trypsin, Chymotrypsin, Trypsin+LysC, LysN, ArgC proteases suitable for different mass spec machines.| Try ESI |
 |
|---|
| ChTry ESI |
 |
|---|
| ArgC ESI |
 |
|---|
| LysN ESI |
 |
|---|
| TryLysC ESI |
 |
|---|
| Try MALDI |
 |
|---|
| ChTry MALDI |
 |
|---|
| ArgC MALDI |
 |
|---|
| LysN MALDI |
 |
|---|
| TryLysC MALDI |
 |
|---|
| Try LTQ |
 |
|---|
| ChTry LTQ |
 |
|---|
| ArgC LTQ |
 |
|---|
| LysN LTQ |
 |
|---|
| TryLysC LTQ |
 |
|---|
| Try MSlow |
 |
|---|
| ChTry MSlow |
 |
|---|
| ArgC MSlow |
 |
|---|
| LysN MSlow |
 |
|---|
| TryLysC MSlow |
 |
|---|
| Try MShigh |
 |
|---|
| ChTry MShigh |
 |
|---|
| ArgC MShigh |
 |
|---|
| LysN MShigh |
 |
|---|
| TryLysC MShigh |
 |
|---|
General Statistics
Number of major isoforms |
Number of additional isoforms |
Number of all proteins |
Number of amino acids |
Min. Seq. Length |
Max. Seq. Length |
Avg. Seq. Length |
Avg. Mol. Weight |
|---|---|---|---|---|---|---|---|
0 |
1549698 |
28 |
2324 |
321.7 |
34.51 |
Amino acid frequency
Ala |
Cys |
Asp |
Glu |
Phe |
Gly |
His |
Ile |
Lys |
Leu |
|---|---|---|---|---|---|---|---|---|---|
13.037 ± 0.047 | 0.763 ± 0.009 |
6.661 ± 0.028 | 5.669 ± 0.037 |
2.794 ± 0.017 | 9.28 ± 0.033 |
2.29 ± 0.017 | 3.169 ± 0.026 |
1.814 ± 0.026 | 10.315 ± 0.047 |
Met |
Asn |
Gln |
Pro |
Arg |
Ser |
Thr |
Val |
Trp |
Tyr |
|---|---|---|---|---|---|---|---|---|---|
1.817 ± 0.012 | 1.713 ± 0.017 |
5.748 ± 0.029 | 2.644 ± 0.021 |
8.0 ± 0.045 | 5.09 ± 0.026 |
6.091 ± 0.032 | 9.533 ± 0.038 |
1.592 ± 0.017 | 1.978 ± 0.017 |
Most of the basic statistics you can see at this page can be downloaded from this CSV file
Proteome-pI is available under Creative Commons Attribution-NoDerivs license, for more details see here
| Reference: Kozlowski LP. Proteome-pI 2.0: Proteome Isoelectric Point Database Update. Nucleic Acids Res. 2021, doi: 10.1093/nar/gkab944 | Contact: Lukasz P. Kozlowski |
