Klebsiella quasipneumoniae subsp. similipneumoniae
Taxonomy: cellular organisms; Bacteria; Proteobacteria; Gammaproteobacteria; Enterobacterales; Enterobacteriaceae;
Average proteome isoelectric point is 6.81
Get precalculated fractions of proteins
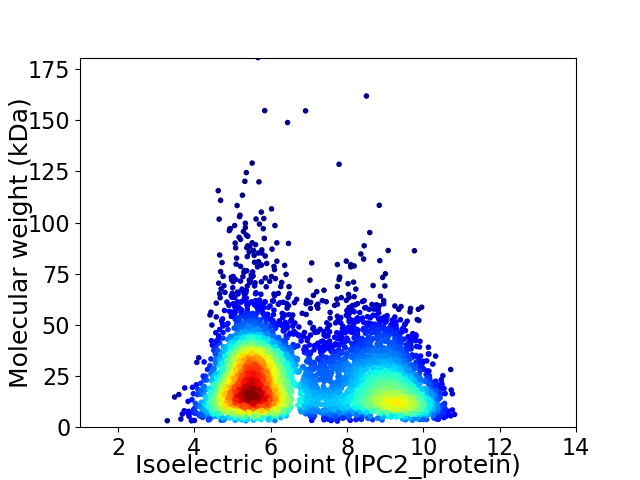
Virtual 2D-PAGE plot for 5434 proteins (isoelectric point calculated using IPC2_protein)
Get csv file with sequences according to given criteria:
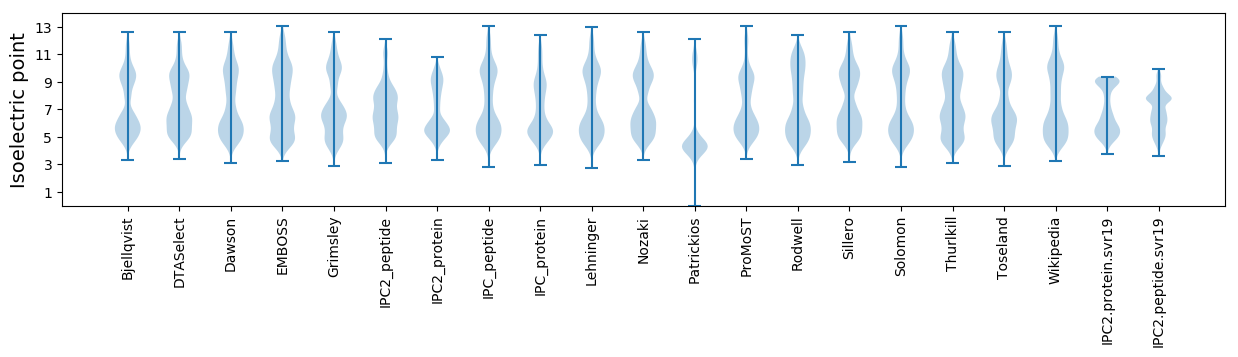
* You can choose from 21 different methods for calculating isoelectric point
Summary statistics related to proteome-wise predictions
Protein with the lowest isoelectric point:
>tr|A0A663B3H6|A0A663B3H6_9ENTR Uncharacterized protein OS=Klebsiella quasipneumoniae subsp. similipneumoniae OX=1463164 GN=SB00610_01721 PE=4 SV=1
MM1 pKa = 7.63SDD3 pKa = 3.42AFFEE7 pKa = 4.28EE8 pKa = 4.82LTDD11 pKa = 3.83GDD13 pKa = 5.25AIPDD17 pKa = 3.48QSQFDD22 pKa = 3.06IWYY25 pKa = 9.67EE26 pKa = 3.95EE27 pKa = 4.11LCAYY31 pKa = 10.4ALDD34 pKa = 3.95HH35 pKa = 6.96SGRR38 pKa = 11.84APYY41 pKa = 10.25KK42 pKa = 9.02MAWLEE47 pKa = 3.91FFEE50 pKa = 4.57QGMTVEE56 pKa = 4.26VAFDD60 pKa = 3.35KK61 pKa = 10.93FYY63 pKa = 11.12EE64 pKa = 4.16
MM1 pKa = 7.63SDD3 pKa = 3.42AFFEE7 pKa = 4.28EE8 pKa = 4.82LTDD11 pKa = 3.83GDD13 pKa = 5.25AIPDD17 pKa = 3.48QSQFDD22 pKa = 3.06IWYY25 pKa = 9.67EE26 pKa = 3.95EE27 pKa = 4.11LCAYY31 pKa = 10.4ALDD34 pKa = 3.95HH35 pKa = 6.96SGRR38 pKa = 11.84APYY41 pKa = 10.25KK42 pKa = 9.02MAWLEE47 pKa = 3.91FFEE50 pKa = 4.57QGMTVEE56 pKa = 4.26VAFDD60 pKa = 3.35KK61 pKa = 10.93FYY63 pKa = 11.12EE64 pKa = 4.16
Molecular weight: 7.55 kDa
Isoelectric point according different methods:
Protein with the highest isoelectric point:
>tr|A0A663BJW4|A0A663BJW4_9ENTR Putative hydrolase YxeP OS=Klebsiella quasipneumoniae subsp. similipneumoniae OX=1463164 GN=yxeP_3 PE=4 SV=1
MM1 pKa = 7.41HH2 pKa = 7.72LILLRR7 pKa = 11.84IRR9 pKa = 11.84RR10 pKa = 11.84DD11 pKa = 3.28NFITLIQRR19 pKa = 11.84IIIIGRR25 pKa = 11.84QRR27 pKa = 11.84QINILRR33 pKa = 11.84AVWQGIGQIARR44 pKa = 11.84VLIANRR50 pKa = 11.84RR51 pKa = 11.84QQ52 pKa = 3.04
MM1 pKa = 7.41HH2 pKa = 7.72LILLRR7 pKa = 11.84IRR9 pKa = 11.84RR10 pKa = 11.84DD11 pKa = 3.28NFITLIQRR19 pKa = 11.84IIIIGRR25 pKa = 11.84QRR27 pKa = 11.84QINILRR33 pKa = 11.84AVWQGIGQIARR44 pKa = 11.84VLIANRR50 pKa = 11.84RR51 pKa = 11.84QQ52 pKa = 3.04
Molecular weight: 6.24 kDa
Isoelectric point according different methods:
Peptides (in silico digests for buttom-up proteomics)
Below you can find in silico digests of the whole proteome with Trypsin, Chymotrypsin, Trypsin+LysC, LysN, ArgC proteases suitable for different mass spec machines.| Try ESI |
 |
|---|
| ChTry ESI |
|
|---|
| ArgC ESI |
|
|---|
| LysN ESI |
|
|---|
| TryLysC ESI |
|
|---|
| Try MALDI |
|
|---|
| ChTry MALDI |
|
|---|
| ArgC MALDI |
|
|---|
| LysN MALDI |
|
|---|
| TryLysC MALDI |
|
|---|
| Try LTQ |
|
|---|
| ChTry LTQ |
|
|---|
| ArgC LTQ |
|
|---|
| LysN LTQ |
|
|---|
| TryLysC LTQ |
|
|---|
| Try MSlow |
|
|---|
| ChTry MSlow |
|
|---|
| ArgC MSlow |
|
|---|
| LysN MSlow |
|
|---|
| TryLysC MSlow |
|
|---|
| Try MShigh |
|
|---|
| ChTry MShigh |
|
|---|
| ArgC MShigh |
|
|---|
| LysN MShigh |
|
|---|
| TryLysC MShigh |
|
|---|
General Statistics
Number of major isoforms |
Number of additional isoforms |
Number of all proteins |
Number of amino acids |
Min. Seq. Length |
Max. Seq. Length |
Avg. Seq. Length |
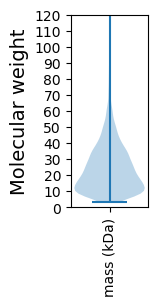
Avg. Mol. Weight |
|---|---|---|---|---|---|---|---|
0 |
1237787 |
29 |
1660 |
227.8 |
25.21 |
Amino acid frequency
Ala |
Cys |
Asp |
Glu |
Phe |
Gly |
His |
Ile |
Lys |
Leu |
|---|---|---|---|---|---|---|---|---|---|
10.204 ± 0.044 | 1.099 ± 0.014 |
5.164 ± 0.029 | 5.405 ± 0.037 |
4.033 ± 0.025 | 7.52 ± 0.037 |
2.538 ± 0.024 | 5.654 ± 0.028 |
3.984 ± 0.034 | 10.772 ± 0.054 |
Met |
Asn |
Gln |
Pro |
Arg |
Ser |
Thr |
Val |
Trp |
Tyr |
|---|---|---|---|---|---|---|---|---|---|
2.75 ± 0.015 | 3.462 ± 0.025 |
4.476 ± 0.025 | 4.642 ± 0.027 |
6.289 ± 0.031 | 5.65 ± 0.031 |
5.089 ± 0.025 | 7.14 ± 0.028 |
1.475 ± 0.017 | 2.653 ± 0.025 |
Most of the basic statistics you can see at this page can be downloaded from this CSV file
See this proteome in:

Proteome-pI is available under Creative Commons Attribution-NoDerivs license, for more details see here
| Reference: Kozlowski LP. Proteome-pI 2.0: Proteome Isoelectric Point Database Update. Nucleic Acids Res. 2021, doi: 10.1093/nar/gkab944 | Contact: Lukasz P. Kozlowski |