Stagonospora sp. SRC1lsM3a
Taxonomy: cellular organisms; Eukaryota; Opisthokonta; Fungi; Dikarya; Ascomycota; saccharomyceta; Pezizomycotina; leotiomyceta; dothideomyceta; Dothideomycetes; Pleosporomycetidae; Pleosporales; Massarineae; Massarinaceae; Stagonospora; unclassified Stagonospora
Average proteome isoelectric point is 6.59
Get precalculated fractions of proteins
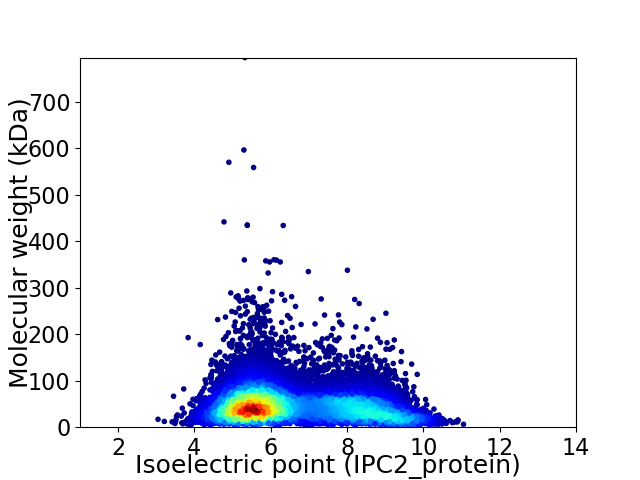
Virtual 2D-PAGE plot for 14420 proteins (isoelectric point calculated using IPC2_protein)
Get csv file with sequences according to given criteria:
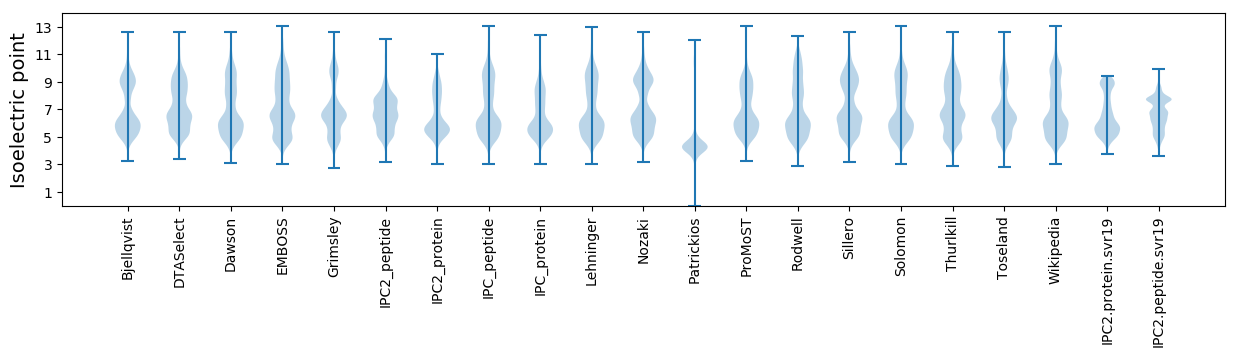
* You can choose from 21 different methods for calculating isoelectric point
Summary statistics related to proteome-wise predictions
Protein with the lowest isoelectric point:
>tr|A0A178ASY3|A0A178ASY3_9PLEO Histone-fold-containing protein OS=Stagonospora sp. SRC1lsM3a OX=765868 GN=IQ06DRAFT_336281 PE=4 SV=1
MM1 pKa = 7.74DD2 pKa = 4.09TLEE5 pKa = 4.19RR6 pKa = 11.84QQLRR10 pKa = 11.84LTDD13 pKa = 3.81TEE15 pKa = 4.21DD16 pKa = 3.22TGPVLSFVDD25 pKa = 4.76FEE27 pKa = 4.68VGDD30 pKa = 5.04DD31 pKa = 4.39INDD34 pKa = 3.51TSIGYY39 pKa = 9.22EE40 pKa = 3.93GYY42 pKa = 11.03NYY44 pKa = 10.4VEE46 pKa = 4.31VSAVQSVLFEE56 pKa = 4.74LNYY59 pKa = 9.44PDD61 pKa = 4.54PYY63 pKa = 11.36GPISGKK69 pKa = 7.5TPRR72 pKa = 11.84LLPLGYY78 pKa = 10.15SITEE82 pKa = 4.19GVQDD86 pKa = 3.68SSGNGYY92 pKa = 9.83RR93 pKa = 11.84DD94 pKa = 2.91GRR96 pKa = 11.84ADD98 pKa = 3.72YY99 pKa = 10.87LVGAMTTVVV108 pKa = 3.09
MM1 pKa = 7.74DD2 pKa = 4.09TLEE5 pKa = 4.19RR6 pKa = 11.84QQLRR10 pKa = 11.84LTDD13 pKa = 3.81TEE15 pKa = 4.21DD16 pKa = 3.22TGPVLSFVDD25 pKa = 4.76FEE27 pKa = 4.68VGDD30 pKa = 5.04DD31 pKa = 4.39INDD34 pKa = 3.51TSIGYY39 pKa = 9.22EE40 pKa = 3.93GYY42 pKa = 11.03NYY44 pKa = 10.4VEE46 pKa = 4.31VSAVQSVLFEE56 pKa = 4.74LNYY59 pKa = 9.44PDD61 pKa = 4.54PYY63 pKa = 11.36GPISGKK69 pKa = 7.5TPRR72 pKa = 11.84LLPLGYY78 pKa = 10.15SITEE82 pKa = 4.19GVQDD86 pKa = 3.68SSGNGYY92 pKa = 9.83RR93 pKa = 11.84DD94 pKa = 2.91GRR96 pKa = 11.84ADD98 pKa = 3.72YY99 pKa = 10.87LVGAMTTVVV108 pKa = 3.09
Molecular weight: 11.84 kDa
Isoelectric point according different methods:
Protein with the highest isoelectric point:
>tr|A0A178AWR1|A0A178AWR1_9PLEO Uncharacterized protein OS=Stagonospora sp. SRC1lsM3a OX=765868 GN=IQ06DRAFT_368481 PE=4 SV=1
MM1 pKa = 7.25KK2 pKa = 10.43VSIIALFAAGAIAAPLAAPQAPSGTPVVPGFPGGAPSGGPGGFPGGFPSGFPAPTGGFPGFPSGGFPAPTGGFPRR77 pKa = 11.84PTGPRR82 pKa = 11.84PSGGPGGSRR91 pKa = 11.84PTGGPRR97 pKa = 11.84PTGGPRR103 pKa = 11.84PSGAPPVFSGGPAVPAPTITT123 pKa = 3.41
MM1 pKa = 7.25KK2 pKa = 10.43VSIIALFAAGAIAAPLAAPQAPSGTPVVPGFPGGAPSGGPGGFPGGFPSGFPAPTGGFPGFPSGGFPAPTGGFPRR77 pKa = 11.84PTGPRR82 pKa = 11.84PSGGPGGSRR91 pKa = 11.84PTGGPRR97 pKa = 11.84PTGGPRR103 pKa = 11.84PSGAPPVFSGGPAVPAPTITT123 pKa = 3.41
Molecular weight: 11.27 kDa
Isoelectric point according different methods:
Peptides (in silico digests for buttom-up proteomics)
Below you can find in silico digests of the whole proteome with Trypsin, Chymotrypsin, Trypsin+LysC, LysN, ArgC proteases suitable for different mass spec machines.| Try ESI |
 |
|---|
| ChTry ESI |
|
|---|
| ArgC ESI |
|
|---|
| LysN ESI |
|
|---|
| TryLysC ESI |
|
|---|
| Try MALDI |
|
|---|
| ChTry MALDI |
|
|---|
| ArgC MALDI |
|
|---|
| LysN MALDI |
|
|---|
| TryLysC MALDI |
|
|---|
| Try LTQ |
|
|---|
| ChTry LTQ |
|
|---|
| ArgC LTQ |
|
|---|
| LysN LTQ |
|
|---|
| TryLysC LTQ |
|
|---|
| Try MSlow |
|
|---|
| ChTry MSlow |
|
|---|
| ArgC MSlow |
|
|---|
| LysN MSlow |
|
|---|
| TryLysC MSlow |
|
|---|
| Try MShigh |
|
|---|
| ChTry MShigh |
|
|---|
| ArgC MShigh |
|
|---|
| LysN MShigh |
|
|---|
| TryLysC MShigh |
|
|---|
General Statistics
Number of major isoforms |
Number of additional isoforms |
Number of all proteins |
Number of amino acids |
Min. Seq. Length |
Max. Seq. Length |
Avg. Seq. Length |
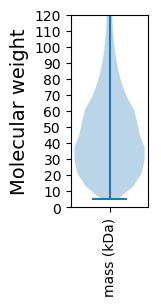
Avg. Mol. Weight |
|---|---|---|---|---|---|---|---|
0 |
6584226 |
49 |
7200 |
456.6 |
50.59 |
Amino acid frequency
Ala |
Cys |
Asp |
Glu |
Phe |
Gly |
His |
Ile |
Lys |
Leu |
|---|---|---|---|---|---|---|---|---|---|
8.801 ± 0.018 | 1.327 ± 0.009 |
5.673 ± 0.015 | 5.998 ± 0.02 |
3.739 ± 0.013 | 6.784 ± 0.02 |
2.493 ± 0.01 | 4.92 ± 0.014 |
4.936 ± 0.017 | 8.715 ± 0.018 |
Met |
Asn |
Gln |
Pro |
Arg |
Ser |
Thr |
Val |
Trp |
Tyr |
|---|---|---|---|---|---|---|---|---|---|
2.262 ± 0.007 | 3.711 ± 0.012 |
5.901 ± 0.024 | 4.053 ± 0.016 |
5.995 ± 0.017 | 8.08 ± 0.024 |
6.066 ± 0.014 | 6.118 ± 0.016 |
1.561 ± 0.008 | 2.866 ± 0.011 |
Most of the basic statistics you can see at this page can be downloaded from this CSV file
See this proteome in:

Proteome-pI is available under Creative Commons Attribution-NoDerivs license, for more details see here
| Reference: Kozlowski LP. Proteome-pI 2.0: Proteome Isoelectric Point Database Update. Nucleic Acids Res. 2021, doi: 10.1093/nar/gkab944 | Contact: Lukasz P. Kozlowski |