Arachis duranensis (Wild peanut)
Taxonomy: cellular organisms; Eukaryota; Viridiplantae; Streptophyta; Streptophytina; Embryophyta; Tracheophyta; Euphyllophyta; Spermatophyta; Magnoliopsida; Mesangiospermae; eudicotyledons; Gunneridae; Pentapetalae; rosids; fabids; Fabales; Fabaceae; Papilionoideae; 50 kb inversion clade; dalbergioids sensu lato; Dalbergieae;
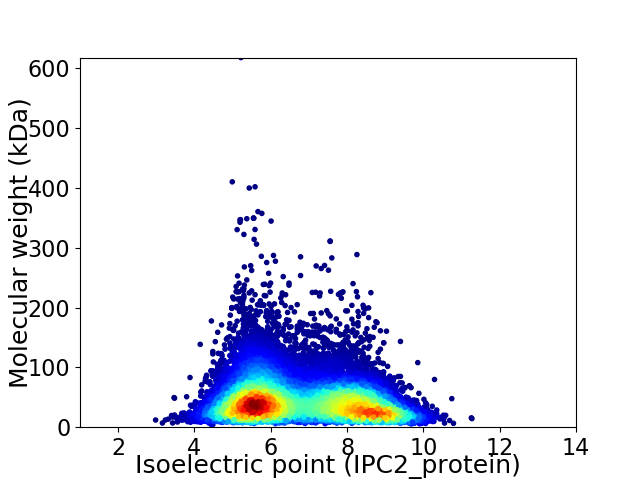
Average proteome isoelectric point is 6.77
Get precalculated fractions of proteins

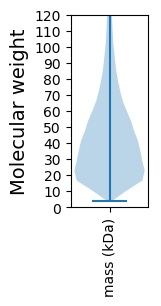
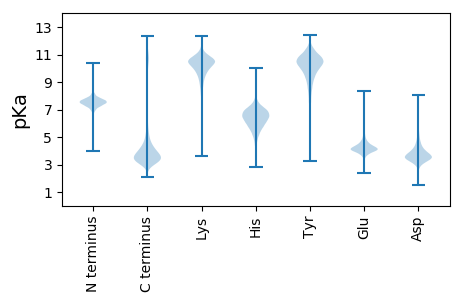
Virtual 2D-PAGE plot for 44786 proteins (isoelectric point calculated using IPC2_protein)
Get csv file with sequences according to given criteria:
* You can choose from 21 different methods for calculating isoelectric point
Summary statistics related to proteome-wise predictions


Protein with the lowest isoelectric point:
>tr|A0A6P5NAA3|A0A6P5NAA3_ARADU protein FAM133 isoform X1 OS=Arachis duranensis OX=130453 GN=LOC107477545 PE=4 SV=1
MM1 pKa = 7.77DD2 pKa = 3.54VKK4 pKa = 11.08GNNVTPDD11 pKa = 3.76FSSYY15 pKa = 11.15ILFEE19 pKa = 4.3ASGDD23 pKa = 3.92SEE25 pKa = 4.75EE26 pKa = 6.19ADD28 pKa = 3.27FDD30 pKa = 4.55HH31 pKa = 6.94NKK33 pKa = 8.6MVCEE37 pKa = 4.39ISRR40 pKa = 11.84VGSYY44 pKa = 7.33VHH46 pKa = 6.96HH47 pKa = 6.22GHH49 pKa = 6.84EE50 pKa = 5.63DD51 pKa = 3.52YY52 pKa = 11.55DD53 pKa = 5.52DD54 pKa = 6.14DD55 pKa = 7.24DD56 pKa = 5.42DD57 pKa = 6.0ALSCSYY63 pKa = 10.96DD64 pKa = 3.59RR65 pKa = 11.84SDD67 pKa = 5.13YY68 pKa = 11.59DD69 pKa = 5.26DD70 pKa = 4.85DD71 pKa = 4.18ACNVAEE77 pKa = 4.81VNWDD81 pKa = 4.18DD82 pKa = 6.48DD83 pKa = 5.97DD84 pKa = 7.68DD85 pKa = 7.44DD86 pKa = 7.49DD87 pKa = 7.49DD88 pKa = 6.86DD89 pKa = 5.28GEE91 pKa = 4.38KK92 pKa = 10.43KK93 pKa = 10.59DD94 pKa = 3.84VVFGTSYY101 pKa = 10.97CDD103 pKa = 3.56EE104 pKa = 4.45EE105 pKa = 6.15DD106 pKa = 3.67EE107 pKa = 4.75VLQEE111 pKa = 3.83QHH113 pKa = 5.93PTRR116 pKa = 11.84SFVSFASNQEE126 pKa = 4.17SLDD129 pKa = 3.6EE130 pKa = 4.11MEE132 pKa = 4.68KK133 pKa = 10.72NRR135 pKa = 11.84LFWEE139 pKa = 4.55ACLASS144 pKa = 3.65
MM1 pKa = 7.77DD2 pKa = 3.54VKK4 pKa = 11.08GNNVTPDD11 pKa = 3.76FSSYY15 pKa = 11.15ILFEE19 pKa = 4.3ASGDD23 pKa = 3.92SEE25 pKa = 4.75EE26 pKa = 6.19ADD28 pKa = 3.27FDD30 pKa = 4.55HH31 pKa = 6.94NKK33 pKa = 8.6MVCEE37 pKa = 4.39ISRR40 pKa = 11.84VGSYY44 pKa = 7.33VHH46 pKa = 6.96HH47 pKa = 6.22GHH49 pKa = 6.84EE50 pKa = 5.63DD51 pKa = 3.52YY52 pKa = 11.55DD53 pKa = 5.52DD54 pKa = 6.14DD55 pKa = 7.24DD56 pKa = 5.42DD57 pKa = 6.0ALSCSYY63 pKa = 10.96DD64 pKa = 3.59RR65 pKa = 11.84SDD67 pKa = 5.13YY68 pKa = 11.59DD69 pKa = 5.26DD70 pKa = 4.85DD71 pKa = 4.18ACNVAEE77 pKa = 4.81VNWDD81 pKa = 4.18DD82 pKa = 6.48DD83 pKa = 5.97DD84 pKa = 7.68DD85 pKa = 7.44DD86 pKa = 7.49DD87 pKa = 7.49DD88 pKa = 6.86DD89 pKa = 5.28GEE91 pKa = 4.38KK92 pKa = 10.43KK93 pKa = 10.59DD94 pKa = 3.84VVFGTSYY101 pKa = 10.97CDD103 pKa = 3.56EE104 pKa = 4.45EE105 pKa = 6.15DD106 pKa = 3.67EE107 pKa = 4.75VLQEE111 pKa = 3.83QHH113 pKa = 5.93PTRR116 pKa = 11.84SFVSFASNQEE126 pKa = 4.17SLDD129 pKa = 3.6EE130 pKa = 4.11MEE132 pKa = 4.68KK133 pKa = 10.72NRR135 pKa = 11.84LFWEE139 pKa = 4.55ACLASS144 pKa = 3.65
Molecular weight: 16.43 kDa
Isoelectric point according different methods:
Protein with the highest isoelectric point:
>tr|A0A6P4BCF6|A0A6P4BCF6_ARADU uncharacterized protein LOC107461533 OS=Arachis duranensis OX=130453 GN=LOC107461533 PE=4 SV=1
MM1 pKa = 7.29AAWVSNYY8 pKa = 9.79NPSATRR14 pKa = 11.84TLSVARR20 pKa = 11.84PPPPSSPSLLPLPSTTTQPPPTPPGRR46 pKa = 11.84RR47 pKa = 11.84RR48 pKa = 11.84PPRR51 pKa = 11.84RR52 pKa = 11.84RR53 pKa = 11.84RR54 pKa = 11.84HH55 pKa = 5.6LPPLSSSLLSSSFFFPPSSATAHH78 pKa = 5.75LRR80 pKa = 11.84ATARR84 pKa = 11.84RR85 pKa = 11.84RR86 pKa = 11.84HH87 pKa = 6.05RR88 pKa = 11.84PTATPLQPATPPLPLPPATSLPHH111 pKa = 6.45SPPPPTRR118 pKa = 11.84FRR120 pKa = 11.84NTQTLLSVRR129 pKa = 11.84SFSS132 pKa = 3.68
MM1 pKa = 7.29AAWVSNYY8 pKa = 9.79NPSATRR14 pKa = 11.84TLSVARR20 pKa = 11.84PPPPSSPSLLPLPSTTTQPPPTPPGRR46 pKa = 11.84RR47 pKa = 11.84RR48 pKa = 11.84PPRR51 pKa = 11.84RR52 pKa = 11.84RR53 pKa = 11.84RR54 pKa = 11.84HH55 pKa = 5.6LPPLSSSLLSSSFFFPPSSATAHH78 pKa = 5.75LRR80 pKa = 11.84ATARR84 pKa = 11.84RR85 pKa = 11.84RR86 pKa = 11.84HH87 pKa = 6.05RR88 pKa = 11.84PTATPLQPATPPLPLPPATSLPHH111 pKa = 6.45SPPPPTRR118 pKa = 11.84FRR120 pKa = 11.84NTQTLLSVRR129 pKa = 11.84SFSS132 pKa = 3.68
Molecular weight: 14.36 kDa
Isoelectric point according different methods:
Peptides (in silico digests for buttom-up proteomics)
Below you can find in silico digests of the whole proteome with Trypsin, Chymotrypsin, Trypsin+LysC, LysN, ArgC proteases suitable for different mass spec machines.| Try ESI |
 |
|---|
| ChTry ESI |
 |
|---|
| ArgC ESI |
 |
|---|
| LysN ESI |
 |
|---|
| TryLysC ESI |
 |
|---|
| Try MALDI |
 |
|---|
| ChTry MALDI |
 |
|---|
| ArgC MALDI |
 |
|---|
| LysN MALDI |
 |
|---|
| TryLysC MALDI |
 |
|---|
| Try LTQ |
 |
|---|
| ChTry LTQ |
 |
|---|
| ArgC LTQ |
 |
|---|
| LysN LTQ |
 |
|---|
| TryLysC LTQ |
 |
|---|
| Try MSlow |
 |
|---|
| ChTry MSlow |
 |
|---|
| ArgC MSlow |
 |
|---|
| LysN MSlow |
 |
|---|
| TryLysC MSlow |
 |
|---|
| Try MShigh |
 |
|---|
| ChTry MShigh |
 |
|---|
| ArgC MShigh |
 |
|---|
| LysN MShigh |
 |
|---|
| TryLysC MShigh |
 |
|---|
General Statistics
Number of major isoforms |
Number of additional isoforms |
Number of all proteins |
Number of amino acids |
Min. Seq. Length |
Max. Seq. Length |
Avg. Seq. Length |
Avg. Mol. Weight |
|---|---|---|---|---|---|---|---|
19145231 |
37 |
5423 |
427.5 |
47.9 |
Amino acid frequency
Ala |
Cys |
Asp |
Glu |
Phe |
Gly |
His |
Ile |
Lys |
Leu |
|---|---|---|---|---|---|---|---|---|---|
6.506 ± 0.011 | 1.932 ± 0.005 |
5.353 ± 0.007 | 6.483 ± 0.012 |
4.223 ± 0.007 | 6.203 ± 0.011 |
2.572 ± 0.005 | 5.434 ± 0.009 |
6.256 ± 0.012 | 9.686 ± 0.015 |
Met |
Asn |
Gln |
Pro |
Arg |
Ser |
Thr |
Val |
Trp |
Tyr |
|---|---|---|---|---|---|---|---|---|---|
2.456 ± 0.005 | 4.72 ± 0.008 |
4.823 ± 0.01 | 3.769 ± 0.008 |
5.279 ± 0.009 | 8.803 ± 0.012 |
4.889 ± 0.006 | 6.427 ± 0.007 |
1.298 ± 0.004 | 2.875 ± 0.006 |
Most of the basic statistics you can see at this page can be downloaded from this CSV file
Proteome-pI is available under Creative Commons Attribution-NoDerivs license, for more details see here
| Reference: Kozlowski LP. Proteome-pI 2.0: Proteome Isoelectric Point Database Update. Nucleic Acids Res. 2021, doi: 10.1093/nar/gkab944 | Contact: Lukasz P. Kozlowski |
