Lysobacter aestuarii
Taxonomy: cellular organisms; Bacteria; Proteobacteria; Gammaproteobacteria; Xanthomonadales; Xanthomonadaceae; Lysobacter
Average proteome isoelectric point is 6.43
Get precalculated fractions of proteins

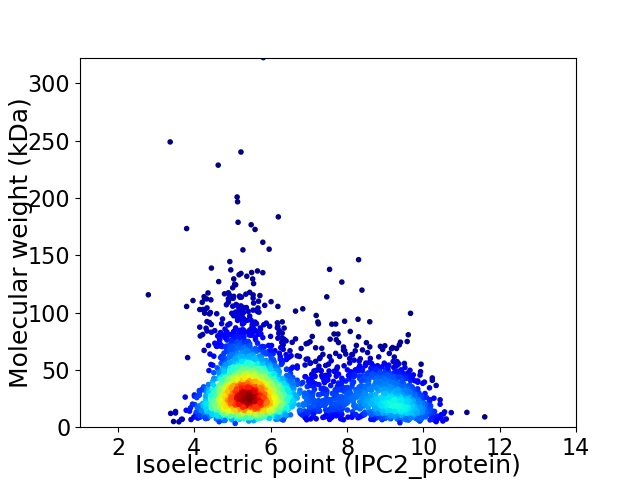
Virtual 2D-PAGE plot for 3124 proteins (isoelectric point calculated using IPC2_protein)
Get csv file with sequences according to given criteria:
* You can choose from 21 different methods for calculating isoelectric point
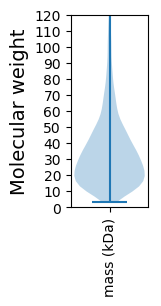
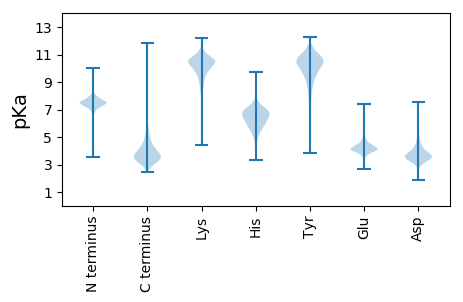
Summary statistics related to proteome-wise predictions


Protein with the lowest isoelectric point:
>tr|A0A508AM07|A0A508AM07_9GAMM Type I secretion system permease/ATPase OS=Lysobacter aestuarii OX=1706195 GN=FKV25_06390 PE=4 SV=1
MM1 pKa = 7.55SSHH4 pKa = 5.66TKK6 pKa = 9.74IVASKK11 pKa = 9.48FATRR15 pKa = 11.84GMPSVLLMAMFAAMGMARR33 pKa = 11.84AEE35 pKa = 4.16AGEE38 pKa = 4.1VSGSITLTSDD48 pKa = 3.21YY49 pKa = 10.35LFRR52 pKa = 11.84GITQTNEE59 pKa = 3.26EE60 pKa = 4.41PALQGGIEE68 pKa = 4.05YY69 pKa = 10.4AADD72 pKa = 3.14SGFYY76 pKa = 10.25AGAWGSSISWLSDD89 pKa = 2.95SDD91 pKa = 4.2PDD93 pKa = 3.37ISSQVEE99 pKa = 3.17IDD101 pKa = 3.69GYY103 pKa = 10.8LGYY106 pKa = 10.6RR107 pKa = 11.84GDD109 pKa = 4.18FGDD112 pKa = 3.89SGVGYY117 pKa = 10.44DD118 pKa = 4.45VGAIYY123 pKa = 10.48YY124 pKa = 7.44WYY126 pKa = 9.76PGDD129 pKa = 3.81YY130 pKa = 10.47PSGFNSADD138 pKa = 3.24TTEE141 pKa = 4.35VYY143 pKa = 10.53FGVGWSFLSAKK154 pKa = 10.03YY155 pKa = 10.42SYY157 pKa = 11.43AVTDD161 pKa = 4.04LFGIPDD167 pKa = 3.84SDD169 pKa = 3.75GSSALDD175 pKa = 4.47LGASWEE181 pKa = 4.25VAPGWSLDD189 pKa = 3.63AAVGKK194 pKa = 9.86QWVEE198 pKa = 3.81NVDD201 pKa = 3.73GGDD204 pKa = 3.4YY205 pKa = 10.68AYY207 pKa = 9.76WKK209 pKa = 10.39VGAGKK214 pKa = 10.54SFDD217 pKa = 3.63NGFDD221 pKa = 3.0IAVAYY226 pKa = 10.39NDD228 pKa = 4.03NDD230 pKa = 4.82LIGPDD235 pKa = 3.89EE236 pKa = 4.25TWTFAVTKK244 pKa = 10.51SFF246 pKa = 3.8
MM1 pKa = 7.55SSHH4 pKa = 5.66TKK6 pKa = 9.74IVASKK11 pKa = 9.48FATRR15 pKa = 11.84GMPSVLLMAMFAAMGMARR33 pKa = 11.84AEE35 pKa = 4.16AGEE38 pKa = 4.1VSGSITLTSDD48 pKa = 3.21YY49 pKa = 10.35LFRR52 pKa = 11.84GITQTNEE59 pKa = 3.26EE60 pKa = 4.41PALQGGIEE68 pKa = 4.05YY69 pKa = 10.4AADD72 pKa = 3.14SGFYY76 pKa = 10.25AGAWGSSISWLSDD89 pKa = 2.95SDD91 pKa = 4.2PDD93 pKa = 3.37ISSQVEE99 pKa = 3.17IDD101 pKa = 3.69GYY103 pKa = 10.8LGYY106 pKa = 10.6RR107 pKa = 11.84GDD109 pKa = 4.18FGDD112 pKa = 3.89SGVGYY117 pKa = 10.44DD118 pKa = 4.45VGAIYY123 pKa = 10.48YY124 pKa = 7.44WYY126 pKa = 9.76PGDD129 pKa = 3.81YY130 pKa = 10.47PSGFNSADD138 pKa = 3.24TTEE141 pKa = 4.35VYY143 pKa = 10.53FGVGWSFLSAKK154 pKa = 10.03YY155 pKa = 10.42SYY157 pKa = 11.43AVTDD161 pKa = 4.04LFGIPDD167 pKa = 3.84SDD169 pKa = 3.75GSSALDD175 pKa = 4.47LGASWEE181 pKa = 4.25VAPGWSLDD189 pKa = 3.63AAVGKK194 pKa = 9.86QWVEE198 pKa = 3.81NVDD201 pKa = 3.73GGDD204 pKa = 3.4YY205 pKa = 10.68AYY207 pKa = 9.76WKK209 pKa = 10.39VGAGKK214 pKa = 10.54SFDD217 pKa = 3.63NGFDD221 pKa = 3.0IAVAYY226 pKa = 10.39NDD228 pKa = 4.03NDD230 pKa = 4.82LIGPDD235 pKa = 3.89EE236 pKa = 4.25TWTFAVTKK244 pKa = 10.51SFF246 pKa = 3.8
Molecular weight: 26.27 kDa
Isoelectric point according different methods:
Protein with the highest isoelectric point:
>tr|A0A508A9E4|A0A508A9E4_9GAMM ATP-binding protein OS=Lysobacter aestuarii OX=1706195 GN=FKV25_06580 PE=4 SV=1
MM1 pKa = 7.52PARR4 pKa = 11.84RR5 pKa = 11.84PRR7 pKa = 11.84ARR9 pKa = 11.84PRR11 pKa = 11.84SRR13 pKa = 11.84GRR15 pKa = 11.84KK16 pKa = 8.33GRR18 pKa = 11.84ARR20 pKa = 11.84PPSPPLPRR28 pKa = 11.84RR29 pKa = 11.84RR30 pKa = 11.84RR31 pKa = 11.84SSRR34 pKa = 11.84PGHH37 pKa = 5.22QPFLRR42 pKa = 11.84SPTRR46 pKa = 11.84HH47 pKa = 4.46TRR49 pKa = 11.84HH50 pKa = 5.63RR51 pKa = 11.84RR52 pKa = 11.84MPRR55 pKa = 11.84RR56 pKa = 11.84PLRR59 pKa = 11.84RR60 pKa = 11.84KK61 pKa = 9.83APSRR65 pKa = 11.84SIAVAGPTPIARR77 pKa = 3.96
MM1 pKa = 7.52PARR4 pKa = 11.84RR5 pKa = 11.84PRR7 pKa = 11.84ARR9 pKa = 11.84PRR11 pKa = 11.84SRR13 pKa = 11.84GRR15 pKa = 11.84KK16 pKa = 8.33GRR18 pKa = 11.84ARR20 pKa = 11.84PPSPPLPRR28 pKa = 11.84RR29 pKa = 11.84RR30 pKa = 11.84RR31 pKa = 11.84SSRR34 pKa = 11.84PGHH37 pKa = 5.22QPFLRR42 pKa = 11.84SPTRR46 pKa = 11.84HH47 pKa = 4.46TRR49 pKa = 11.84HH50 pKa = 5.63RR51 pKa = 11.84RR52 pKa = 11.84MPRR55 pKa = 11.84RR56 pKa = 11.84PLRR59 pKa = 11.84RR60 pKa = 11.84KK61 pKa = 9.83APSRR65 pKa = 11.84SIAVAGPTPIARR77 pKa = 3.96
Molecular weight: 8.99 kDa
Isoelectric point according different methods:
Peptides (in silico digests for buttom-up proteomics)
Below you can find in silico digests of the whole proteome with Trypsin, Chymotrypsin, Trypsin+LysC, LysN, ArgC proteases suitable for different mass spec machines.| Try ESI |
 |
|---|
| ChTry ESI |
 |
|---|
| ArgC ESI |
 |
|---|
| LysN ESI |
 |
|---|
| TryLysC ESI |
 |
|---|
| Try MALDI |
 |
|---|
| ChTry MALDI |
 |
|---|
| ArgC MALDI |
 |
|---|
| LysN MALDI |
 |
|---|
| TryLysC MALDI |
 |
|---|
| Try LTQ |
 |
|---|
| ChTry LTQ |
 |
|---|
| ArgC LTQ |
 |
|---|
| LysN LTQ |
 |
|---|
| TryLysC LTQ |
 |
|---|
| Try MSlow |
 |
|---|
| ChTry MSlow |
 |
|---|
| ArgC MSlow |
 |
|---|
| LysN MSlow |
 |
|---|
| TryLysC MSlow |
 |
|---|
| Try MShigh |
 |
|---|
| ChTry MShigh |
 |
|---|
| ArgC MShigh |
 |
|---|
| LysN MShigh |
 |
|---|
| TryLysC MShigh |
 |
|---|
General Statistics
Number of major isoforms |
Number of additional isoforms |
Number of all proteins |
Number of amino acids |
Min. Seq. Length |
Max. Seq. Length |
Avg. Seq. Length |
Avg. Mol. Weight |
|---|---|---|---|---|---|---|---|
0 |
1031292 |
30 |
2907 |
330.1 |
35.77 |
Amino acid frequency
Ala |
Cys |
Asp |
Glu |
Phe |
Gly |
His |
Ile |
Lys |
Leu |
|---|---|---|---|---|---|---|---|---|---|
13.268 ± 0.057 | 0.839 ± 0.013 |
6.257 ± 0.038 | 5.605 ± 0.044 |
3.31 ± 0.03 | 8.951 ± 0.04 |
2.301 ± 0.024 | 3.891 ± 0.029 |
2.367 ± 0.035 | 10.583 ± 0.062 |
Met |
Asn |
Gln |
Pro |
Arg |
Ser |
Thr |
Val |
Trp |
Tyr |
|---|---|---|---|---|---|---|---|---|---|
2.238 ± 0.021 | 2.281 ± 0.028 |
5.586 ± 0.035 | 3.257 ± 0.026 |
8.061 ± 0.052 | 5.066 ± 0.029 |
4.74 ± 0.045 | 7.595 ± 0.042 |
1.555 ± 0.023 | 2.25 ± 0.024 |
Most of the basic statistics you can see at this page can be downloaded from this CSV file
Proteome-pI is available under Creative Commons Attribution-NoDerivs license, for more details see here
| Reference: Kozlowski LP. Proteome-pI 2.0: Proteome Isoelectric Point Database Update. Nucleic Acids Res. 2021, doi: 10.1093/nar/gkab944 | Contact: Lukasz P. Kozlowski |
