Actinopolyspora mzabensis
Taxonomy: cellular organisms; Bacteria; Terrabacteria group; Actinobacteria; Actinomycetia; Actinopolysporales; Actinopolysporaceae; Actinopolyspora
Average proteome isoelectric point is 6.12
Get precalculated fractions of proteins

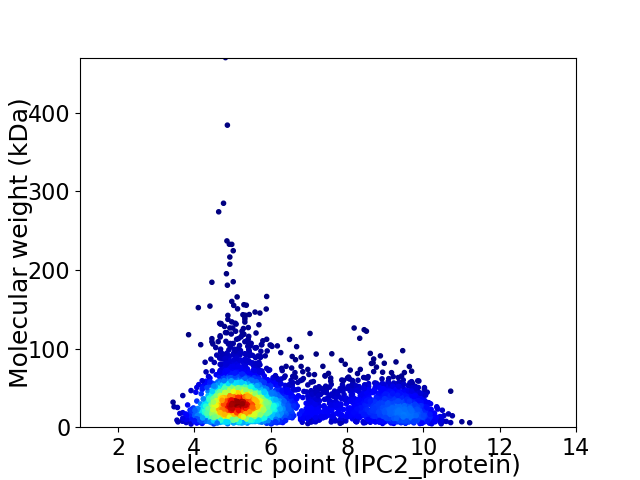
Virtual 2D-PAGE plot for 4438 proteins (isoelectric point calculated using IPC2_protein)
Get csv file with sequences according to given criteria:
* You can choose from 21 different methods for calculating isoelectric point
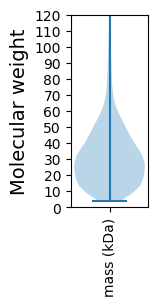
Summary statistics related to proteome-wise predictions


Protein with the lowest isoelectric point:
>tr|A0A1G9BHW2|A0A1G9BHW2_9ACTN Uncharacterized protein OS=Actinopolyspora mzabensis OX=995066 GN=SAMN04487820_107165 PE=4 SV=1
MM1 pKa = 7.62RR2 pKa = 11.84KK3 pKa = 9.27SVLSNCCSAVLAAALLPMLAPAASAVTDD31 pKa = 3.46RR32 pKa = 11.84ADD34 pKa = 3.36PVEE37 pKa = 4.29YY38 pKa = 10.54VALGDD43 pKa = 4.14SYY45 pKa = 11.99ASGVGIGNYY54 pKa = 8.14TPEE57 pKa = 5.27SGDD60 pKa = 3.84CLRR63 pKa = 11.84SPQAYY68 pKa = 7.67PRR70 pKa = 11.84LVADD74 pKa = 4.85RR75 pKa = 11.84GAVDD79 pKa = 3.6SLDD82 pKa = 3.6FAACAGAEE90 pKa = 4.26TPDD93 pKa = 3.57VLNEE97 pKa = 3.92QVTALSSSTDD107 pKa = 3.33VVTVSIGGNDD117 pKa = 3.23AGFVDD122 pKa = 6.53VITTCNTGGDD132 pKa = 3.9QTCDD136 pKa = 3.45DD137 pKa = 4.48AVTEE141 pKa = 4.27AEE143 pKa = 4.5NYY145 pKa = 7.52ATQQLPAEE153 pKa = 4.2LAEE156 pKa = 4.49TYY158 pKa = 10.65DD159 pKa = 4.52AIGAAAPQARR169 pKa = 11.84VAVVGYY175 pKa = 9.27PRR177 pKa = 11.84LFEE180 pKa = 5.33LGSCLSLLSEE190 pKa = 4.58FEE192 pKa = 4.02RR193 pKa = 11.84GRR195 pKa = 11.84LNDD198 pKa = 3.89AADD201 pKa = 3.78TLDD204 pKa = 4.12SVIAEE209 pKa = 4.01QAAAAGFSFLDD220 pKa = 3.39VRR222 pKa = 11.84DD223 pKa = 4.28DD224 pKa = 4.05FSGHH228 pKa = 5.46GVCGAQPWINGLSYY242 pKa = 9.8PAEE245 pKa = 4.12EE246 pKa = 4.76SFHH249 pKa = 6.94PDD251 pKa = 2.82AAGHH255 pKa = 5.31EE256 pKa = 4.44QGFLPDD262 pKa = 3.25VSGFLATQSPLASS275 pKa = 3.45
MM1 pKa = 7.62RR2 pKa = 11.84KK3 pKa = 9.27SVLSNCCSAVLAAALLPMLAPAASAVTDD31 pKa = 3.46RR32 pKa = 11.84ADD34 pKa = 3.36PVEE37 pKa = 4.29YY38 pKa = 10.54VALGDD43 pKa = 4.14SYY45 pKa = 11.99ASGVGIGNYY54 pKa = 8.14TPEE57 pKa = 5.27SGDD60 pKa = 3.84CLRR63 pKa = 11.84SPQAYY68 pKa = 7.67PRR70 pKa = 11.84LVADD74 pKa = 4.85RR75 pKa = 11.84GAVDD79 pKa = 3.6SLDD82 pKa = 3.6FAACAGAEE90 pKa = 4.26TPDD93 pKa = 3.57VLNEE97 pKa = 3.92QVTALSSSTDD107 pKa = 3.33VVTVSIGGNDD117 pKa = 3.23AGFVDD122 pKa = 6.53VITTCNTGGDD132 pKa = 3.9QTCDD136 pKa = 3.45DD137 pKa = 4.48AVTEE141 pKa = 4.27AEE143 pKa = 4.5NYY145 pKa = 7.52ATQQLPAEE153 pKa = 4.2LAEE156 pKa = 4.49TYY158 pKa = 10.65DD159 pKa = 4.52AIGAAAPQARR169 pKa = 11.84VAVVGYY175 pKa = 9.27PRR177 pKa = 11.84LFEE180 pKa = 5.33LGSCLSLLSEE190 pKa = 4.58FEE192 pKa = 4.02RR193 pKa = 11.84GRR195 pKa = 11.84LNDD198 pKa = 3.89AADD201 pKa = 3.78TLDD204 pKa = 4.12SVIAEE209 pKa = 4.01QAAAAGFSFLDD220 pKa = 3.39VRR222 pKa = 11.84DD223 pKa = 4.28DD224 pKa = 4.05FSGHH228 pKa = 5.46GVCGAQPWINGLSYY242 pKa = 9.8PAEE245 pKa = 4.12EE246 pKa = 4.76SFHH249 pKa = 6.94PDD251 pKa = 2.82AAGHH255 pKa = 5.31EE256 pKa = 4.44QGFLPDD262 pKa = 3.25VSGFLATQSPLASS275 pKa = 3.45
Molecular weight: 28.3 kDa
Isoelectric point according different methods:
Protein with the highest isoelectric point:
>tr|A0A1G9AJX2|A0A1G9AJX2_9ACTN Uncharacterized protein OS=Actinopolyspora mzabensis OX=995066 GN=SAMN04487820_10693 PE=4 SV=1
MM1 pKa = 7.47SKK3 pKa = 10.58GKK5 pKa = 8.48RR6 pKa = 11.84TYY8 pKa = 10.26QPNNRR13 pKa = 11.84KK14 pKa = 9.12RR15 pKa = 11.84ARR17 pKa = 11.84THH19 pKa = 6.07GFRR22 pKa = 11.84QRR24 pKa = 11.84MHH26 pKa = 5.44TRR28 pKa = 11.84AGRR31 pKa = 11.84AIVTARR37 pKa = 11.84RR38 pKa = 11.84RR39 pKa = 11.84RR40 pKa = 11.84GRR42 pKa = 11.84KK43 pKa = 9.15RR44 pKa = 11.84LTAA47 pKa = 4.25
MM1 pKa = 7.47SKK3 pKa = 10.58GKK5 pKa = 8.48RR6 pKa = 11.84TYY8 pKa = 10.26QPNNRR13 pKa = 11.84KK14 pKa = 9.12RR15 pKa = 11.84ARR17 pKa = 11.84THH19 pKa = 6.07GFRR22 pKa = 11.84QRR24 pKa = 11.84MHH26 pKa = 5.44TRR28 pKa = 11.84AGRR31 pKa = 11.84AIVTARR37 pKa = 11.84RR38 pKa = 11.84RR39 pKa = 11.84RR40 pKa = 11.84GRR42 pKa = 11.84KK43 pKa = 9.15RR44 pKa = 11.84LTAA47 pKa = 4.25
Molecular weight: 5.65 kDa
Isoelectric point according different methods:
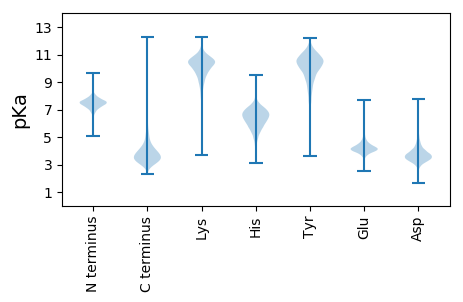
Peptides (in silico digests for buttom-up proteomics)
Below you can find in silico digests of the whole proteome with Trypsin, Chymotrypsin, Trypsin+LysC, LysN, ArgC proteases suitable for different mass spec machines.| Try ESI |
 |
|---|
| ChTry ESI |
 |
|---|
| ArgC ESI |
 |
|---|
| LysN ESI |
 |
|---|
| TryLysC ESI |
 |
|---|
| Try MALDI |
 |
|---|
| ChTry MALDI |
 |
|---|
| ArgC MALDI |
 |
|---|
| LysN MALDI |
 |
|---|
| TryLysC MALDI |
 |
|---|
| Try LTQ |
 |
|---|
| ChTry LTQ |
 |
|---|
| ArgC LTQ |
 |
|---|
| LysN LTQ |
 |
|---|
| TryLysC LTQ |
 |
|---|
| Try MSlow |
 |
|---|
| ChTry MSlow |
 |
|---|
| ArgC MSlow |
 |
|---|
| LysN MSlow |
 |
|---|
| TryLysC MSlow |
 |
|---|
| Try MShigh |
 |
|---|
| ChTry MShigh |
 |
|---|
| ArgC MShigh |
 |
|---|
| LysN MShigh |
 |
|---|
| TryLysC MShigh |
 |
|---|
General Statistics
Number of major isoforms |
Number of additional isoforms |
Number of all proteins |
Number of amino acids |
Min. Seq. Length |
Max. Seq. Length |
Avg. Seq. Length |
Avg. Mol. Weight |
|---|---|---|---|---|---|---|---|
0 |
1404463 |
39 |
4364 |
316.5 |
34.19 |
Amino acid frequency
Ala |
Cys |
Asp |
Glu |
Phe |
Gly |
His |
Ile |
Lys |
Leu |
|---|---|---|---|---|---|---|---|---|---|
11.694 ± 0.051 | 0.827 ± 0.011 |
5.775 ± 0.031 | 6.871 ± 0.047 |
2.782 ± 0.023 | 9.246 ± 0.04 |
2.371 ± 0.02 | 3.261 ± 0.028 |
1.769 ± 0.022 | 10.332 ± 0.048 |
Met |
Asn |
Gln |
Pro |
Arg |
Ser |
Thr |
Val |
Trp |
Tyr |
|---|---|---|---|---|---|---|---|---|---|
1.835 ± 0.015 | 2.17 ± 0.019 |
5.665 ± 0.03 | 2.838 ± 0.024 |
8.437 ± 0.039 | 6.161 ± 0.033 |
6.067 ± 0.026 | 8.453 ± 0.036 |
1.476 ± 0.016 | 1.97 ± 0.018 |
Most of the basic statistics you can see at this page can be downloaded from this CSV file
Proteome-pI is available under Creative Commons Attribution-NoDerivs license, for more details see here
| Reference: Kozlowski LP. Proteome-pI 2.0: Proteome Isoelectric Point Database Update. Nucleic Acids Res. 2021, doi: 10.1093/nar/gkab944 | Contact: Lukasz P. Kozlowski |
