Pseudodesulfovibrio profundus
Taxonomy: cellular organisms; Bacteria; Proteobacteria; delta/epsilon subdivisions; Deltaproteobacteria; Desulfovibrionales; Desulfovibrionaceae; Pseudodesulfovibrio
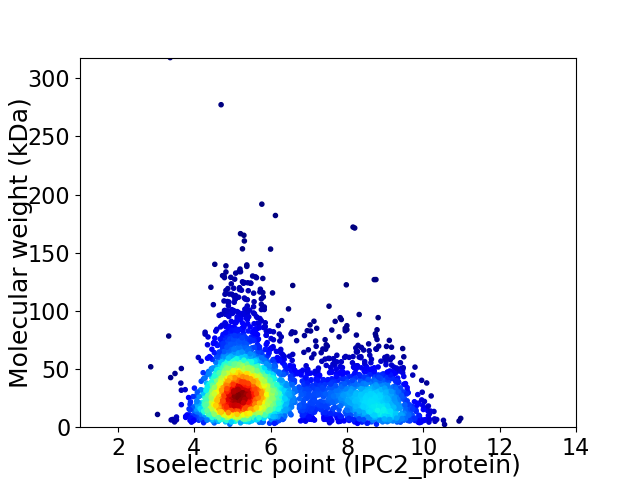
Average proteome isoelectric point is 6.17
Get precalculated fractions of proteins

Virtual 2D-PAGE plot for 3808 proteins (isoelectric point calculated using IPC2_protein)
Get csv file with sequences according to given criteria:
* You can choose from 21 different methods for calculating isoelectric point
Summary statistics related to proteome-wise predictions


Protein with the lowest isoelectric point:
>tr|A0A2C8FBT4|A0A2C8FBT4_9DELT Endolytic murein transglycosylase OS=Pseudodesulfovibrio profundus OX=57320 GN=yceG PE=3 SV=1
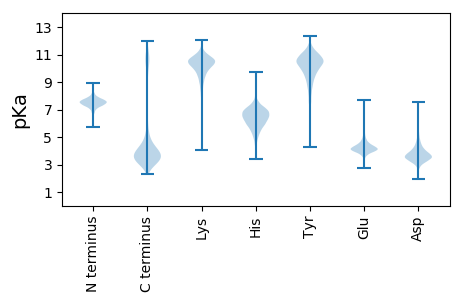
MM1 pKa = 7.73EE2 pKa = 5.46NNNEE6 pKa = 4.42NINNMSRR13 pKa = 11.84DD14 pKa = 4.02FEE16 pKa = 4.65PEE18 pKa = 3.69SATDD22 pKa = 3.89FFVHH26 pKa = 7.18DD27 pKa = 4.01RR28 pKa = 11.84LEE30 pKa = 4.14NRR32 pKa = 11.84AEE34 pKa = 4.11PEE36 pKa = 4.23SVRR39 pKa = 11.84LQIDD43 pKa = 2.98WRR45 pKa = 11.84DD46 pKa = 3.17GSIDD50 pKa = 3.58VVTIAQHH57 pKa = 6.16QMNSWSSEE65 pKa = 3.68EE66 pKa = 3.63WHH68 pKa = 6.65GLVGVYY74 pKa = 7.84QVNYY78 pKa = 10.17DD79 pKa = 3.32ADD81 pKa = 3.8AFALAEE87 pKa = 4.11WVDD90 pKa = 4.04EE91 pKa = 4.04NMGMLSRR98 pKa = 11.84IHH100 pKa = 6.84ACFDD104 pKa = 3.55EE105 pKa = 4.97HH106 pKa = 6.93WDD108 pKa = 3.35GSNFVGEE115 pKa = 4.25FDD117 pKa = 4.3FDD119 pKa = 3.86NDD121 pKa = 3.27EE122 pKa = 4.11EE123 pKa = 5.93AGDD126 pKa = 3.92FLEE129 pKa = 6.44HH130 pKa = 6.71EE131 pKa = 4.28LQLYY135 pKa = 10.06GIMVEE140 pKa = 4.15SHH142 pKa = 5.47GVAMVDD148 pKa = 3.15AGDD151 pKa = 3.99YY152 pKa = 9.87FCEE155 pKa = 4.44SFWIQDD161 pKa = 3.8GMLHH165 pKa = 6.18TDD167 pKa = 4.4LRR169 pKa = 11.84DD170 pKa = 3.48TPYY173 pKa = 11.16SLSEE177 pKa = 4.29LGDD180 pKa = 3.38EE181 pKa = 4.86GEE183 pKa = 4.82YY184 pKa = 10.46ILEE187 pKa = 4.15ALMDD191 pKa = 4.13NDD193 pKa = 5.57KK194 pKa = 11.35SDD196 pKa = 3.85EE197 pKa = 4.15SQMAVCTLDD206 pKa = 3.39YY207 pKa = 10.88AKK209 pKa = 10.95EE210 pKa = 3.79LMYY213 pKa = 10.68DD214 pKa = 3.87LRR216 pKa = 11.84NACAEE221 pKa = 4.03
MM1 pKa = 7.73EE2 pKa = 5.46NNNEE6 pKa = 4.42NINNMSRR13 pKa = 11.84DD14 pKa = 4.02FEE16 pKa = 4.65PEE18 pKa = 3.69SATDD22 pKa = 3.89FFVHH26 pKa = 7.18DD27 pKa = 4.01RR28 pKa = 11.84LEE30 pKa = 4.14NRR32 pKa = 11.84AEE34 pKa = 4.11PEE36 pKa = 4.23SVRR39 pKa = 11.84LQIDD43 pKa = 2.98WRR45 pKa = 11.84DD46 pKa = 3.17GSIDD50 pKa = 3.58VVTIAQHH57 pKa = 6.16QMNSWSSEE65 pKa = 3.68EE66 pKa = 3.63WHH68 pKa = 6.65GLVGVYY74 pKa = 7.84QVNYY78 pKa = 10.17DD79 pKa = 3.32ADD81 pKa = 3.8AFALAEE87 pKa = 4.11WVDD90 pKa = 4.04EE91 pKa = 4.04NMGMLSRR98 pKa = 11.84IHH100 pKa = 6.84ACFDD104 pKa = 3.55EE105 pKa = 4.97HH106 pKa = 6.93WDD108 pKa = 3.35GSNFVGEE115 pKa = 4.25FDD117 pKa = 4.3FDD119 pKa = 3.86NDD121 pKa = 3.27EE122 pKa = 4.11EE123 pKa = 5.93AGDD126 pKa = 3.92FLEE129 pKa = 6.44HH130 pKa = 6.71EE131 pKa = 4.28LQLYY135 pKa = 10.06GIMVEE140 pKa = 4.15SHH142 pKa = 5.47GVAMVDD148 pKa = 3.15AGDD151 pKa = 3.99YY152 pKa = 9.87FCEE155 pKa = 4.44SFWIQDD161 pKa = 3.8GMLHH165 pKa = 6.18TDD167 pKa = 4.4LRR169 pKa = 11.84DD170 pKa = 3.48TPYY173 pKa = 11.16SLSEE177 pKa = 4.29LGDD180 pKa = 3.38EE181 pKa = 4.86GEE183 pKa = 4.82YY184 pKa = 10.46ILEE187 pKa = 4.15ALMDD191 pKa = 4.13NDD193 pKa = 5.57KK194 pKa = 11.35SDD196 pKa = 3.85EE197 pKa = 4.15SQMAVCTLDD206 pKa = 3.39YY207 pKa = 10.88AKK209 pKa = 10.95EE210 pKa = 3.79LMYY213 pKa = 10.68DD214 pKa = 3.87LRR216 pKa = 11.84NACAEE221 pKa = 4.03
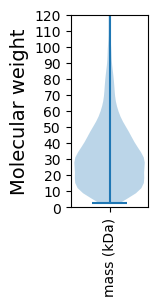
Molecular weight: 25.46 kDa
Isoelectric point according different methods:
Protein with the highest isoelectric point:
>tr|A0A2C8FEF2|A0A2C8FEF2_9DELT HTH asnC-type domain-containing protein OS=Pseudodesulfovibrio profundus OX=57320 GN=DPRO_4004 PE=4 SV=1
MM1 pKa = 7.7PKK3 pKa = 9.95IKK5 pKa = 9.47TRR7 pKa = 11.84RR8 pKa = 11.84AAAKK12 pKa = 9.63RR13 pKa = 11.84FSKK16 pKa = 9.46TASGKK21 pKa = 9.4FKK23 pKa = 10.67RR24 pKa = 11.84RR25 pKa = 11.84RR26 pKa = 11.84KK27 pKa = 9.07NLRR30 pKa = 11.84HH31 pKa = 6.24ILTKK35 pKa = 10.67KK36 pKa = 7.68NAKK39 pKa = 9.22RR40 pKa = 11.84KK41 pKa = 9.18RR42 pKa = 11.84RR43 pKa = 11.84LGQSTTVDD51 pKa = 3.67STNMKK56 pKa = 9.79AVRR59 pKa = 11.84RR60 pKa = 11.84QLPNGG65 pKa = 3.51
MM1 pKa = 7.7PKK3 pKa = 9.95IKK5 pKa = 9.47TRR7 pKa = 11.84RR8 pKa = 11.84AAAKK12 pKa = 9.63RR13 pKa = 11.84FSKK16 pKa = 9.46TASGKK21 pKa = 9.4FKK23 pKa = 10.67RR24 pKa = 11.84RR25 pKa = 11.84RR26 pKa = 11.84KK27 pKa = 9.07NLRR30 pKa = 11.84HH31 pKa = 6.24ILTKK35 pKa = 10.67KK36 pKa = 7.68NAKK39 pKa = 9.22RR40 pKa = 11.84KK41 pKa = 9.18RR42 pKa = 11.84RR43 pKa = 11.84LGQSTTVDD51 pKa = 3.67STNMKK56 pKa = 9.79AVRR59 pKa = 11.84RR60 pKa = 11.84QLPNGG65 pKa = 3.51
Molecular weight: 7.58 kDa
Isoelectric point according different methods:
Peptides (in silico digests for buttom-up proteomics)
Below you can find in silico digests of the whole proteome with Trypsin, Chymotrypsin, Trypsin+LysC, LysN, ArgC proteases suitable for different mass spec machines.| Try ESI |
 |
|---|
| ChTry ESI |
 |
|---|
| ArgC ESI |
 |
|---|
| LysN ESI |
 |
|---|
| TryLysC ESI |
 |
|---|
| Try MALDI |
 |
|---|
| ChTry MALDI |
 |
|---|
| ArgC MALDI |
 |
|---|
| LysN MALDI |
 |
|---|
| TryLysC MALDI |
 |
|---|
| Try LTQ |
 |
|---|
| ChTry LTQ |
 |
|---|
| ArgC LTQ |
 |
|---|
| LysN LTQ |
 |
|---|
| TryLysC LTQ |
 |
|---|
| Try MSlow |
 |
|---|
| ChTry MSlow |
 |
|---|
| ArgC MSlow |
 |
|---|
| LysN MSlow |
 |
|---|
| TryLysC MSlow |
 |
|---|
| Try MShigh |
 |
|---|
| ChTry MShigh |
 |
|---|
| ArgC MShigh |
 |
|---|
| LysN MShigh |
 |
|---|
| TryLysC MShigh |
 |
|---|
General Statistics
Number of major isoforms |
Number of additional isoforms |
Number of all proteins |
Number of amino acids |
Min. Seq. Length |
Max. Seq. Length |
Avg. Seq. Length |
Avg. Mol. Weight |
|---|---|---|---|---|---|---|---|
0 |
1187153 |
20 |
3004 |
311.8 |
34.61 |
Amino acid frequency
Ala |
Cys |
Asp |
Glu |
Phe |
Gly |
His |
Ile |
Lys |
Leu |
|---|---|---|---|---|---|---|---|---|---|
8.644 ± 0.036 | 1.268 ± 0.021 |
5.93 ± 0.029 | 6.89 ± 0.04 |
4.143 ± 0.03 | 7.596 ± 0.035 |
2.12 ± 0.019 | 6.013 ± 0.033 |
5.359 ± 0.041 | 9.879 ± 0.04 |
Met |
Asn |
Gln |
Pro |
Arg |
Ser |
Thr |
Val |
Trp |
Tyr |
|---|---|---|---|---|---|---|---|---|---|
2.978 ± 0.02 | 3.502 ± 0.024 |
4.409 ± 0.024 | 3.378 ± 0.025 |
5.543 ± 0.036 | 5.885 ± 0.031 |
5.252 ± 0.033 | 7.165 ± 0.039 |
1.205 ± 0.015 | 2.84 ± 0.022 |
Most of the basic statistics you can see at this page can be downloaded from this CSV file
Proteome-pI is available under Creative Commons Attribution-NoDerivs license, for more details see here
| Reference: Kozlowski LP. Proteome-pI 2.0: Proteome Isoelectric Point Database Update. Nucleic Acids Res. 2021, doi: 10.1093/nar/gkab944 | Contact: Lukasz P. Kozlowski |
