Streptomyces phage MulchMansion
Taxonomy: Viruses; Duplodnaviria; Heunggongvirae; Uroviricota; Caudoviricetes; Caudovirales; Siphoviridae; Samistivirus; unclassified Samistivirus
Average proteome isoelectric point is 6.41
Get precalculated fractions of proteins

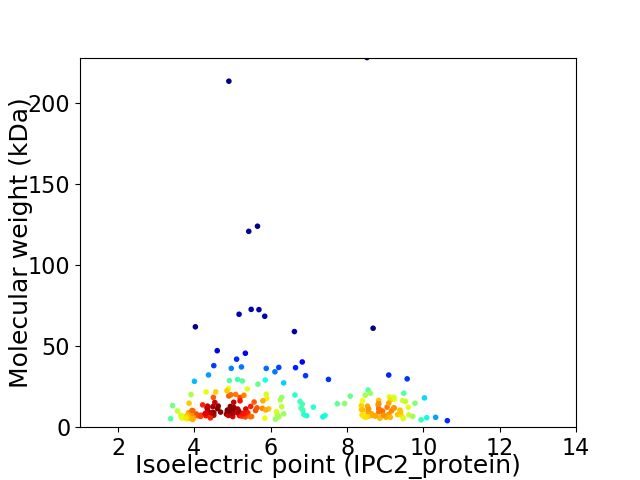
Virtual 2D-PAGE plot for 214 proteins (isoelectric point calculated using IPC2_protein)
Get csv file with sequences according to given criteria:
* You can choose from 21 different methods for calculating isoelectric point
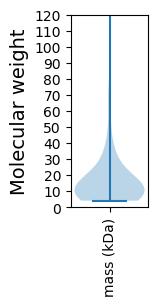
Summary statistics related to proteome-wise predictions


Protein with the lowest isoelectric point:
>tr|A0A7G9W1N5|A0A7G9W1N5_9CAUD Uncharacterized protein OS=Streptomyces phage MulchMansion OX=2768141 GN=141 PE=4 SV=1
MM1 pKa = 7.15TNLYY5 pKa = 10.54GRR7 pKa = 11.84TLRR10 pKa = 11.84GEE12 pKa = 4.2PQDD15 pKa = 3.49NDD17 pKa = 3.07SWPEE21 pKa = 3.84QEE23 pKa = 5.03DD24 pKa = 4.02TQLLINAIDD33 pKa = 3.61AVLDD37 pKa = 3.84MEE39 pKa = 5.11HH40 pKa = 6.06VASVRR45 pKa = 11.84WEE47 pKa = 3.86QYY49 pKa = 9.52TPSFNDD55 pKa = 3.78GEE57 pKa = 4.22PCRR60 pKa = 11.84FSVHH64 pKa = 5.56RR65 pKa = 11.84VSVSLNGFSVPEE77 pKa = 4.33DD78 pKa = 3.96GYY80 pKa = 11.43EE81 pKa = 3.95SSEE84 pKa = 3.96DD85 pKa = 2.81RR86 pKa = 11.84WYY88 pKa = 10.54DD89 pKa = 3.16EE90 pKa = 4.45DD91 pKa = 4.31EE92 pKa = 4.03EE93 pKa = 5.21VFFDD97 pKa = 3.92EE98 pKa = 4.93YY99 pKa = 11.27EE100 pKa = 4.09LYY102 pKa = 10.46EE103 pKa = 4.3YY104 pKa = 8.71GTNEE108 pKa = 4.12DD109 pKa = 4.34GSRR112 pKa = 11.84NWDD115 pKa = 3.14EE116 pKa = 5.32CIYY119 pKa = 9.64EE120 pKa = 4.16VQGIPTEE127 pKa = 4.27EE128 pKa = 3.91IKK130 pKa = 11.08NALKK134 pKa = 9.61TLNQVLDD141 pKa = 3.98SGAHH145 pKa = 4.94YY146 pKa = 10.21AWLMSSFGDD155 pKa = 3.76PAEE158 pKa = 4.3VTATSDD164 pKa = 3.14TFDD167 pKa = 3.48VEE169 pKa = 4.54RR170 pKa = 11.84CEE172 pKa = 5.06HH173 pKa = 5.93EE174 pKa = 3.94
MM1 pKa = 7.15TNLYY5 pKa = 10.54GRR7 pKa = 11.84TLRR10 pKa = 11.84GEE12 pKa = 4.2PQDD15 pKa = 3.49NDD17 pKa = 3.07SWPEE21 pKa = 3.84QEE23 pKa = 5.03DD24 pKa = 4.02TQLLINAIDD33 pKa = 3.61AVLDD37 pKa = 3.84MEE39 pKa = 5.11HH40 pKa = 6.06VASVRR45 pKa = 11.84WEE47 pKa = 3.86QYY49 pKa = 9.52TPSFNDD55 pKa = 3.78GEE57 pKa = 4.22PCRR60 pKa = 11.84FSVHH64 pKa = 5.56RR65 pKa = 11.84VSVSLNGFSVPEE77 pKa = 4.33DD78 pKa = 3.96GYY80 pKa = 11.43EE81 pKa = 3.95SSEE84 pKa = 3.96DD85 pKa = 2.81RR86 pKa = 11.84WYY88 pKa = 10.54DD89 pKa = 3.16EE90 pKa = 4.45DD91 pKa = 4.31EE92 pKa = 4.03EE93 pKa = 5.21VFFDD97 pKa = 3.92EE98 pKa = 4.93YY99 pKa = 11.27EE100 pKa = 4.09LYY102 pKa = 10.46EE103 pKa = 4.3YY104 pKa = 8.71GTNEE108 pKa = 4.12DD109 pKa = 4.34GSRR112 pKa = 11.84NWDD115 pKa = 3.14EE116 pKa = 5.32CIYY119 pKa = 9.64EE120 pKa = 4.16VQGIPTEE127 pKa = 4.27EE128 pKa = 3.91IKK130 pKa = 11.08NALKK134 pKa = 9.61TLNQVLDD141 pKa = 3.98SGAHH145 pKa = 4.94YY146 pKa = 10.21AWLMSSFGDD155 pKa = 3.76PAEE158 pKa = 4.3VTATSDD164 pKa = 3.14TFDD167 pKa = 3.48VEE169 pKa = 4.54RR170 pKa = 11.84CEE172 pKa = 5.06HH173 pKa = 5.93EE174 pKa = 3.94
Molecular weight: 20.11 kDa
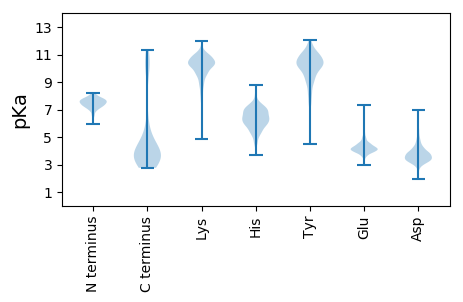
Isoelectric point according different methods:
Protein with the highest isoelectric point:
>tr|A0A7G9W1N0|A0A7G9W1N0_9CAUD Uncharacterized protein OS=Streptomyces phage MulchMansion OX=2768141 GN=129 PE=4 SV=1
MM1 pKa = 7.37ISKK4 pKa = 10.23EE5 pKa = 3.78EE6 pKa = 3.93RR7 pKa = 11.84QQLRR11 pKa = 11.84LARR14 pKa = 11.84SKK16 pKa = 11.44AEE18 pKa = 3.96LVRR21 pKa = 11.84TVAALFQMVMATATLCILVYY41 pKa = 10.78VNFMRR46 pKa = 5.65
MM1 pKa = 7.37ISKK4 pKa = 10.23EE5 pKa = 3.78EE6 pKa = 3.93RR7 pKa = 11.84QQLRR11 pKa = 11.84LARR14 pKa = 11.84SKK16 pKa = 11.44AEE18 pKa = 3.96LVRR21 pKa = 11.84TVAALFQMVMATATLCILVYY41 pKa = 10.78VNFMRR46 pKa = 5.65
Molecular weight: 5.33 kDa
Isoelectric point according different methods:
Peptides (in silico digests for buttom-up proteomics)
Below you can find in silico digests of the whole proteome with Trypsin, Chymotrypsin, Trypsin+LysC, LysN, ArgC proteases suitable for different mass spec machines.| Try ESI |
 |
|---|
| ChTry ESI |
 |
|---|
| ArgC ESI |
 |
|---|
| LysN ESI |
 |
|---|
| TryLysC ESI |
 |
|---|
| Try MALDI |
 |
|---|
| ChTry MALDI |
 |
|---|
| ArgC MALDI |
 |
|---|
| LysN MALDI |
 |
|---|
| TryLysC MALDI |
 |
|---|
| Try LTQ |
 |
|---|
| ChTry LTQ |
 |
|---|
| ArgC LTQ |
 |
|---|
| LysN LTQ |
 |
|---|
| TryLysC LTQ |
 |
|---|
| Try MSlow |
 |
|---|
| ChTry MSlow |
 |
|---|
| ArgC MSlow |
 |
|---|
| LysN MSlow |
 |
|---|
| TryLysC MSlow |
 |
|---|
| Try MShigh |
 |
|---|
| ChTry MShigh |
 |
|---|
| ArgC MShigh |
 |
|---|
| LysN MShigh |
 |
|---|
| TryLysC MShigh |
 |
|---|
General Statistics
Number of major isoforms |
Number of additional isoforms |
Number of all proteins |
Number of amino acids |
Min. Seq. Length |
Max. Seq. Length |
Avg. Seq. Length |
Avg. Mol. Weight |
|---|---|---|---|---|---|---|---|
0 |
34848 |
34 |
2105 |
162.8 |
18.26 |
Amino acid frequency
Ala |
Cys |
Asp |
Glu |
Phe |
Gly |
His |
Ile |
Lys |
Leu |
|---|---|---|---|---|---|---|---|---|---|
8.219 ± 0.38 | 1.024 ± 0.115 |
6.546 ± 0.206 | 7.036 ± 0.334 |
3.848 ± 0.134 | 7.65 ± 0.215 |
1.92 ± 0.133 | 5.349 ± 0.145 |
6.379 ± 0.309 | 7.145 ± 0.193 |
Met |
Asn |
Gln |
Pro |
Arg |
Ser |
Thr |
Val |
Trp |
Tyr |
|---|---|---|---|---|---|---|---|---|---|
2.861 ± 0.127 | 4.454 ± 0.157 |
3.71 ± 0.154 | 3.159 ± 0.183 |
5.567 ± 0.197 | 6.043 ± 0.228 |
6.195 ± 0.398 | 7.24 ± 0.264 |
1.882 ± 0.092 | 3.771 ± 0.164 |
Most of the basic statistics you can see at this page can be downloaded from this CSV file
Proteome-pI is available under Creative Commons Attribution-NoDerivs license, for more details see here
| Reference: Kozlowski LP. Proteome-pI 2.0: Proteome Isoelectric Point Database Update. Nucleic Acids Res. 2021, doi: 10.1093/nar/gkab944 | Contact: Lukasz P. Kozlowski |
