Sphingomonas sp. HDW15B
Taxonomy: cellular organisms; Bacteria; Proteobacteria; Alphaproteobacteria; Sphingomonadales; Sphingomonadaceae; Sphingomonas
Average proteome isoelectric point is 6.66
Get precalculated fractions of proteins
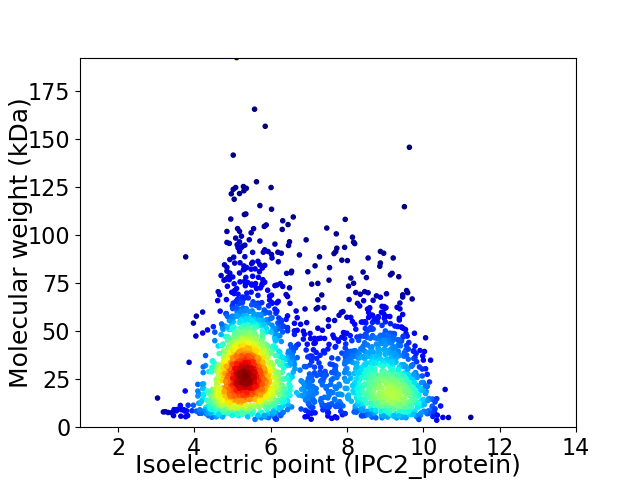
Virtual 2D-PAGE plot for 2594 proteins (isoelectric point calculated using IPC2_protein)
Get csv file with sequences according to given criteria:
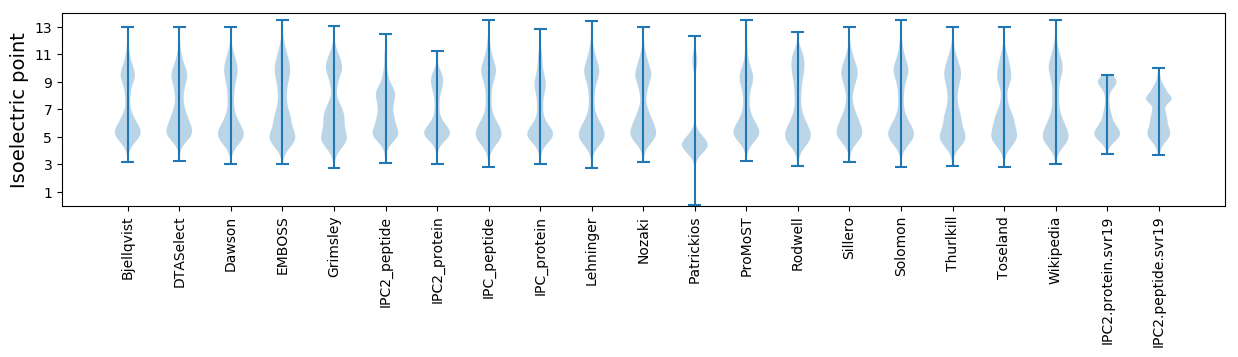
* You can choose from 21 different methods for calculating isoelectric point
Summary statistics related to proteome-wise predictions
Protein with the lowest isoelectric point:
>tr|A0A6G7YQG2|A0A6G7YQG2_9SPHN Maleylacetoacetate isomerase OS=Sphingomonas sp. HDW15B OX=2714943 GN=maiA PE=3 SV=1
MM1 pKa = 7.01QRR3 pKa = 11.84TVLDD7 pKa = 4.29LNSTTVSGSNPSISGIRR24 pKa = 11.84YY25 pKa = 8.13IAPDD29 pKa = 3.39QTGVAPNGKK38 pKa = 9.58QYY40 pKa = 10.01LTLDD44 pKa = 3.75GAVDD48 pKa = 3.32NLTRR52 pKa = 11.84TGGSWNVGGGDD63 pKa = 3.67GKK65 pKa = 9.29ITYY68 pKa = 10.33SFLEE72 pKa = 4.41KK73 pKa = 10.98GPGGQYY79 pKa = 10.81NNPHH83 pKa = 5.17EE84 pKa = 4.61TYY86 pKa = 10.79LAGLVGDD93 pKa = 4.7FSTFTAEE100 pKa = 3.51QRR102 pKa = 11.84AAARR106 pKa = 11.84DD107 pKa = 4.35SIALWDD113 pKa = 4.23DD114 pKa = 3.42VLDD117 pKa = 4.68AEE119 pKa = 4.92FKK121 pKa = 10.24EE122 pKa = 4.7SNGRR126 pKa = 11.84GADD129 pKa = 3.23ILFMNTGEE137 pKa = 4.54GGPGQAAAFIPDD149 pKa = 3.45YY150 pKa = 9.96QGKK153 pKa = 8.78YY154 pKa = 10.54GKK156 pKa = 9.58IEE158 pKa = 3.93GDD160 pKa = 3.68VYY162 pKa = 11.71VNAGQPDD169 pKa = 4.27NFDD172 pKa = 4.04LYY174 pKa = 11.29YY175 pKa = 10.93GGYY178 pKa = 9.09GQTALTHH185 pKa = 6.54EE186 pKa = 4.57IGHH189 pKa = 7.1AIGLSHH195 pKa = 6.82TGDD198 pKa = 3.79YY199 pKa = 10.41NASDD203 pKa = 4.53DD204 pKa = 4.2KK205 pKa = 11.8NGDD208 pKa = 3.75GVPDD212 pKa = 5.8PITYY216 pKa = 10.91ANDD219 pKa = 3.16AEE221 pKa = 5.06FYY223 pKa = 10.34QDD225 pKa = 3.33TYY227 pKa = 11.18QFSIMSYY234 pKa = 8.77FSHH237 pKa = 6.91RR238 pKa = 11.84FSGAFGSVNWATGGYY253 pKa = 8.43YY254 pKa = 7.37QTPQTPMVHH263 pKa = 7.27DD264 pKa = 4.17IAAAQEE270 pKa = 4.27LYY272 pKa = 10.84GVEE275 pKa = 4.06TTTRR279 pKa = 11.84TGNTVYY285 pKa = 10.81GFGSTADD292 pKa = 3.34RR293 pKa = 11.84AVFDD297 pKa = 4.3FSINKK302 pKa = 9.33NPFLTIYY309 pKa = 10.52DD310 pKa = 3.62AGGTDD315 pKa = 3.8MLDD318 pKa = 3.1LSGFTGGRR326 pKa = 11.84ITLDD330 pKa = 3.31LRR332 pKa = 11.84PGAFSTGYY340 pKa = 10.16NYY342 pKa = 10.67GVEE345 pKa = 4.36AEE347 pKa = 4.57LDD349 pKa = 3.89TVGLGNLTQAQWNALYY365 pKa = 10.87DD366 pKa = 3.84GVLGSNPGFLSDD378 pKa = 5.22NIGIAYY384 pKa = 7.28NTTVEE389 pKa = 3.97NGRR392 pKa = 11.84TGAGNDD398 pKa = 3.41VLRR401 pKa = 11.84GNDD404 pKa = 3.28VANSLFGGAGADD416 pKa = 3.4NYY418 pKa = 10.06TGAGGADD425 pKa = 2.87RR426 pKa = 11.84FVIEE430 pKa = 4.82QIGFTDD436 pKa = 4.71TITDD440 pKa = 4.29FAAGVDD446 pKa = 3.97KK447 pKa = 10.9IDD449 pKa = 4.51LKK451 pKa = 11.38AIDD454 pKa = 4.3AVTGGGDD461 pKa = 3.21NAFGFIGSAAFTAAGQLRR479 pKa = 11.84TYY481 pKa = 7.22TTSGVNYY488 pKa = 10.01VAGDD492 pKa = 3.37VDD494 pKa = 4.34GNGVADD500 pKa = 4.08FVINLGSANVAAGDD514 pKa = 3.77FFLL517 pKa = 6.24
MM1 pKa = 7.01QRR3 pKa = 11.84TVLDD7 pKa = 4.29LNSTTVSGSNPSISGIRR24 pKa = 11.84YY25 pKa = 8.13IAPDD29 pKa = 3.39QTGVAPNGKK38 pKa = 9.58QYY40 pKa = 10.01LTLDD44 pKa = 3.75GAVDD48 pKa = 3.32NLTRR52 pKa = 11.84TGGSWNVGGGDD63 pKa = 3.67GKK65 pKa = 9.29ITYY68 pKa = 10.33SFLEE72 pKa = 4.41KK73 pKa = 10.98GPGGQYY79 pKa = 10.81NNPHH83 pKa = 5.17EE84 pKa = 4.61TYY86 pKa = 10.79LAGLVGDD93 pKa = 4.7FSTFTAEE100 pKa = 3.51QRR102 pKa = 11.84AAARR106 pKa = 11.84DD107 pKa = 4.35SIALWDD113 pKa = 4.23DD114 pKa = 3.42VLDD117 pKa = 4.68AEE119 pKa = 4.92FKK121 pKa = 10.24EE122 pKa = 4.7SNGRR126 pKa = 11.84GADD129 pKa = 3.23ILFMNTGEE137 pKa = 4.54GGPGQAAAFIPDD149 pKa = 3.45YY150 pKa = 9.96QGKK153 pKa = 8.78YY154 pKa = 10.54GKK156 pKa = 9.58IEE158 pKa = 3.93GDD160 pKa = 3.68VYY162 pKa = 11.71VNAGQPDD169 pKa = 4.27NFDD172 pKa = 4.04LYY174 pKa = 11.29YY175 pKa = 10.93GGYY178 pKa = 9.09GQTALTHH185 pKa = 6.54EE186 pKa = 4.57IGHH189 pKa = 7.1AIGLSHH195 pKa = 6.82TGDD198 pKa = 3.79YY199 pKa = 10.41NASDD203 pKa = 4.53DD204 pKa = 4.2KK205 pKa = 11.8NGDD208 pKa = 3.75GVPDD212 pKa = 5.8PITYY216 pKa = 10.91ANDD219 pKa = 3.16AEE221 pKa = 5.06FYY223 pKa = 10.34QDD225 pKa = 3.33TYY227 pKa = 11.18QFSIMSYY234 pKa = 8.77FSHH237 pKa = 6.91RR238 pKa = 11.84FSGAFGSVNWATGGYY253 pKa = 8.43YY254 pKa = 7.37QTPQTPMVHH263 pKa = 7.27DD264 pKa = 4.17IAAAQEE270 pKa = 4.27LYY272 pKa = 10.84GVEE275 pKa = 4.06TTTRR279 pKa = 11.84TGNTVYY285 pKa = 10.81GFGSTADD292 pKa = 3.34RR293 pKa = 11.84AVFDD297 pKa = 4.3FSINKK302 pKa = 9.33NPFLTIYY309 pKa = 10.52DD310 pKa = 3.62AGGTDD315 pKa = 3.8MLDD318 pKa = 3.1LSGFTGGRR326 pKa = 11.84ITLDD330 pKa = 3.31LRR332 pKa = 11.84PGAFSTGYY340 pKa = 10.16NYY342 pKa = 10.67GVEE345 pKa = 4.36AEE347 pKa = 4.57LDD349 pKa = 3.89TVGLGNLTQAQWNALYY365 pKa = 10.87DD366 pKa = 3.84GVLGSNPGFLSDD378 pKa = 5.22NIGIAYY384 pKa = 7.28NTTVEE389 pKa = 3.97NGRR392 pKa = 11.84TGAGNDD398 pKa = 3.41VLRR401 pKa = 11.84GNDD404 pKa = 3.28VANSLFGGAGADD416 pKa = 3.4NYY418 pKa = 10.06TGAGGADD425 pKa = 2.87RR426 pKa = 11.84FVIEE430 pKa = 4.82QIGFTDD436 pKa = 4.71TITDD440 pKa = 4.29FAAGVDD446 pKa = 3.97KK447 pKa = 10.9IDD449 pKa = 4.51LKK451 pKa = 11.38AIDD454 pKa = 4.3AVTGGGDD461 pKa = 3.21NAFGFIGSAAFTAAGQLRR479 pKa = 11.84TYY481 pKa = 7.22TTSGVNYY488 pKa = 10.01VAGDD492 pKa = 3.37VDD494 pKa = 4.34GNGVADD500 pKa = 4.08FVINLGSANVAAGDD514 pKa = 3.77FFLL517 pKa = 6.24
Molecular weight: 54.23 kDa
Isoelectric point according different methods:
Protein with the highest isoelectric point:
>tr|A0A6G7YT78|A0A6G7YT78_9SPHN Amidohydrolase OS=Sphingomonas sp. HDW15B OX=2714943 GN=G7077_04425 PE=4 SV=1
MM1 pKa = 7.45KK2 pKa = 9.61RR3 pKa = 11.84TFQPSNLVRR12 pKa = 11.84ARR14 pKa = 11.84RR15 pKa = 11.84HH16 pKa = 4.6GFRR19 pKa = 11.84HH20 pKa = 5.83RR21 pKa = 11.84MATVGGRR28 pKa = 11.84KK29 pKa = 9.07VLNARR34 pKa = 11.84RR35 pKa = 11.84ARR37 pKa = 11.84GRR39 pKa = 11.84KK40 pKa = 9.02KK41 pKa = 10.61LSAA44 pKa = 4.03
MM1 pKa = 7.45KK2 pKa = 9.61RR3 pKa = 11.84TFQPSNLVRR12 pKa = 11.84ARR14 pKa = 11.84RR15 pKa = 11.84HH16 pKa = 4.6GFRR19 pKa = 11.84HH20 pKa = 5.83RR21 pKa = 11.84MATVGGRR28 pKa = 11.84KK29 pKa = 9.07VLNARR34 pKa = 11.84RR35 pKa = 11.84ARR37 pKa = 11.84GRR39 pKa = 11.84KK40 pKa = 9.02KK41 pKa = 10.61LSAA44 pKa = 4.03
Molecular weight: 5.13 kDa
Isoelectric point according different methods:
Peptides (in silico digests for buttom-up proteomics)
Below you can find in silico digests of the whole proteome with Trypsin, Chymotrypsin, Trypsin+LysC, LysN, ArgC proteases suitable for different mass spec machines.| Try ESI |
 |
|---|
| ChTry ESI |
|
|---|
| ArgC ESI |
|
|---|
| LysN ESI |
|
|---|
| TryLysC ESI |
|
|---|
| Try MALDI |
|
|---|
| ChTry MALDI |
|
|---|
| ArgC MALDI |
|
|---|
| LysN MALDI |
|
|---|
| TryLysC MALDI |
|
|---|
| Try LTQ |
|
|---|
| ChTry LTQ |
|
|---|
| ArgC LTQ |
|
|---|
| LysN LTQ |
|
|---|
| TryLysC LTQ |
|
|---|
| Try MSlow |
|
|---|
| ChTry MSlow |
|
|---|
| ArgC MSlow |
|
|---|
| LysN MSlow |
|
|---|
| TryLysC MSlow |
|
|---|
| Try MShigh |
|
|---|
| ChTry MShigh |
|
|---|
| ArgC MShigh |
|
|---|
| LysN MShigh |
|
|---|
| TryLysC MShigh |
|
|---|
General Statistics
Number of major isoforms |
Number of additional isoforms |
Number of all proteins |
Number of amino acids |
Min. Seq. Length |
Max. Seq. Length |
Avg. Seq. Length |
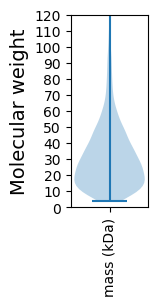
Avg. Mol. Weight |
|---|---|---|---|---|---|---|---|
0 |
771404 |
33 |
1789 |
297.4 |
32.24 |
Amino acid frequency
Ala |
Cys |
Asp |
Glu |
Phe |
Gly |
His |
Ile |
Lys |
Leu |
|---|---|---|---|---|---|---|---|---|---|
12.546 ± 0.072 | 0.816 ± 0.016 |
5.838 ± 0.041 | 5.709 ± 0.037 |
3.57 ± 0.027 | 8.805 ± 0.045 |
1.956 ± 0.022 | 4.84 ± 0.031 |
3.284 ± 0.033 | 10.005 ± 0.056 |
Met |
Asn |
Gln |
Pro |
Arg |
Ser |
Thr |
Val |
Trp |
Tyr |
|---|---|---|---|---|---|---|---|---|---|
2.26 ± 0.025 | 2.68 ± 0.035 |
5.29 ± 0.034 | 3.331 ± 0.027 |
7.434 ± 0.041 | 5.647 ± 0.034 |
5.126 ± 0.034 | 7.268 ± 0.037 |
1.421 ± 0.022 | 2.173 ± 0.025 |
Most of the basic statistics you can see at this page can be downloaded from this CSV file
See this proteome in:

Proteome-pI is available under Creative Commons Attribution-NoDerivs license, for more details see here
| Reference: Kozlowski LP. Proteome-pI 2.0: Proteome Isoelectric Point Database Update. Nucleic Acids Res. 2021, doi: 10.1093/nar/gkab944 | Contact: Lukasz P. Kozlowski |