Vibrio variabilis
Taxonomy: cellular organisms; Bacteria; Proteobacteria; Gammaproteobacteria; Vibrionales; Vibrionaceae; Vibrio
Average proteome isoelectric point is 6.14
Get precalculated fractions of proteins

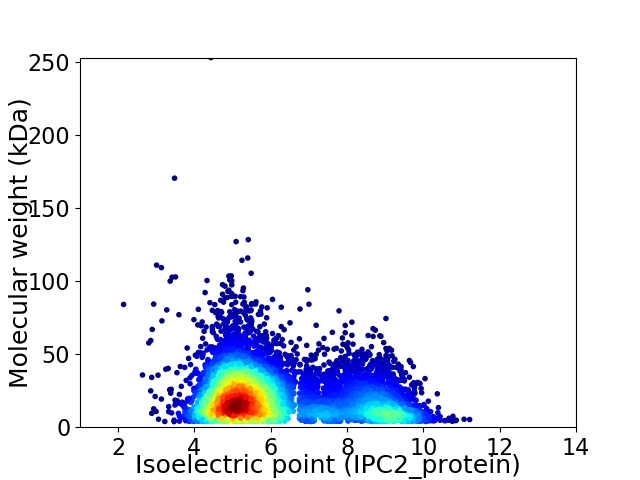
Virtual 2D-PAGE plot for 7941 proteins (isoelectric point calculated using IPC2_protein)
Get csv file with sequences according to given criteria:
* You can choose from 21 different methods for calculating isoelectric point
Summary statistics related to proteome-wise predictions


Protein with the lowest isoelectric point:
>tr|A0A090TFA0|A0A090TFA0_9VIBR Uncharacterized protein OS=Vibrio variabilis OX=990271 GN=JCM19239_6815 PE=4 SV=1
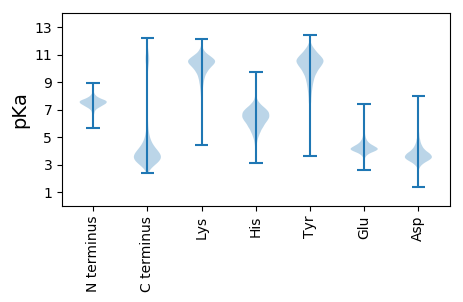
MM1 pKa = 7.34NKK3 pKa = 9.41VALGVATALAAASLSANASLNLNLDD28 pKa = 3.59NEE30 pKa = 4.35VDD32 pKa = 3.43GDD34 pKa = 3.92GDD36 pKa = 3.45IRR38 pKa = 11.84GLFTTVPQGDD48 pKa = 4.11NIFDD52 pKa = 3.53EE53 pKa = 4.63SMNRR57 pKa = 11.84AAHH60 pKa = 6.07NNTTATQDD68 pKa = 3.07SSTTSNGSAIQISLEE83 pKa = 4.05DD84 pKa = 3.66SDD86 pKa = 5.3YY87 pKa = 11.7SDD89 pKa = 3.44INIYY93 pKa = 10.12QSNQATTDD101 pKa = 3.08NSSTYY106 pKa = 10.72DD107 pKa = 3.3GEE109 pKa = 4.28NTVNIDD115 pKa = 3.6FDD117 pKa = 4.5SSLSTGRR124 pKa = 11.84NLDD127 pKa = 3.21NDD129 pKa = 3.43VTINQKK135 pKa = 9.85GDD137 pKa = 3.21RR138 pKa = 11.84NEE140 pKa = 3.96IYY142 pKa = 11.11VLVDD146 pKa = 3.2NEE148 pKa = 3.96APAYY152 pKa = 10.11RR153 pKa = 11.84STGNRR158 pKa = 11.84FNIDD162 pKa = 2.9QDD164 pKa = 4.09GKK166 pKa = 11.12FHH168 pKa = 7.19DD169 pKa = 4.09TTISVLDD176 pKa = 3.87GADD179 pKa = 3.31YY180 pKa = 8.9NTFNVDD186 pKa = 5.8LEE188 pKa = 4.42DD189 pKa = 3.69TNNNVDD195 pKa = 3.06ITVDD199 pKa = 3.15GRR201 pKa = 11.84SAYY204 pKa = 9.74GNSVEE209 pKa = 4.34VTSLNNSDD217 pKa = 3.82GNEE220 pKa = 3.77VSIDD224 pKa = 3.44INDD227 pKa = 3.21GHH229 pKa = 6.47MNVVDD234 pKa = 3.54VDD236 pKa = 3.85HH237 pKa = 7.21RR238 pKa = 11.84GSSDD242 pKa = 3.55DD243 pKa = 3.6NQTKK247 pKa = 10.01VEE249 pKa = 4.12VGGDD253 pKa = 3.54HH254 pKa = 6.98NDD256 pKa = 3.08VYY258 pKa = 11.89VDD260 pKa = 4.05FDD262 pKa = 4.65YY263 pKa = 11.63NSDD266 pKa = 3.8DD267 pKa = 3.66NQVLVEE273 pKa = 4.05VAGNYY278 pKa = 10.14NDD280 pKa = 3.66TDD282 pKa = 3.59IDD284 pKa = 3.63ILGGSDD290 pKa = 3.55YY291 pKa = 11.75NHH293 pKa = 5.99VQVTQLGDD301 pKa = 3.43SSVADD306 pKa = 3.33VRR308 pKa = 11.84LVNGSDD314 pKa = 3.74YY315 pKa = 11.49NDD317 pKa = 4.05MIMVTQTTNDD327 pKa = 3.31YY328 pKa = 11.35ANVYY332 pKa = 9.79GSNADD337 pKa = 3.77YY338 pKa = 11.51NSVTVTQNN346 pKa = 2.55
MM1 pKa = 7.34NKK3 pKa = 9.41VALGVATALAAASLSANASLNLNLDD28 pKa = 3.59NEE30 pKa = 4.35VDD32 pKa = 3.43GDD34 pKa = 3.92GDD36 pKa = 3.45IRR38 pKa = 11.84GLFTTVPQGDD48 pKa = 4.11NIFDD52 pKa = 3.53EE53 pKa = 4.63SMNRR57 pKa = 11.84AAHH60 pKa = 6.07NNTTATQDD68 pKa = 3.07SSTTSNGSAIQISLEE83 pKa = 4.05DD84 pKa = 3.66SDD86 pKa = 5.3YY87 pKa = 11.7SDD89 pKa = 3.44INIYY93 pKa = 10.12QSNQATTDD101 pKa = 3.08NSSTYY106 pKa = 10.72DD107 pKa = 3.3GEE109 pKa = 4.28NTVNIDD115 pKa = 3.6FDD117 pKa = 4.5SSLSTGRR124 pKa = 11.84NLDD127 pKa = 3.21NDD129 pKa = 3.43VTINQKK135 pKa = 9.85GDD137 pKa = 3.21RR138 pKa = 11.84NEE140 pKa = 3.96IYY142 pKa = 11.11VLVDD146 pKa = 3.2NEE148 pKa = 3.96APAYY152 pKa = 10.11RR153 pKa = 11.84STGNRR158 pKa = 11.84FNIDD162 pKa = 2.9QDD164 pKa = 4.09GKK166 pKa = 11.12FHH168 pKa = 7.19DD169 pKa = 4.09TTISVLDD176 pKa = 3.87GADD179 pKa = 3.31YY180 pKa = 8.9NTFNVDD186 pKa = 5.8LEE188 pKa = 4.42DD189 pKa = 3.69TNNNVDD195 pKa = 3.06ITVDD199 pKa = 3.15GRR201 pKa = 11.84SAYY204 pKa = 9.74GNSVEE209 pKa = 4.34VTSLNNSDD217 pKa = 3.82GNEE220 pKa = 3.77VSIDD224 pKa = 3.44INDD227 pKa = 3.21GHH229 pKa = 6.47MNVVDD234 pKa = 3.54VDD236 pKa = 3.85HH237 pKa = 7.21RR238 pKa = 11.84GSSDD242 pKa = 3.55DD243 pKa = 3.6NQTKK247 pKa = 10.01VEE249 pKa = 4.12VGGDD253 pKa = 3.54HH254 pKa = 6.98NDD256 pKa = 3.08VYY258 pKa = 11.89VDD260 pKa = 4.05FDD262 pKa = 4.65YY263 pKa = 11.63NSDD266 pKa = 3.8DD267 pKa = 3.66NQVLVEE273 pKa = 4.05VAGNYY278 pKa = 10.14NDD280 pKa = 3.66TDD282 pKa = 3.59IDD284 pKa = 3.63ILGGSDD290 pKa = 3.55YY291 pKa = 11.75NHH293 pKa = 5.99VQVTQLGDD301 pKa = 3.43SSVADD306 pKa = 3.33VRR308 pKa = 11.84LVNGSDD314 pKa = 3.74YY315 pKa = 11.49NDD317 pKa = 4.05MIMVTQTTNDD327 pKa = 3.31YY328 pKa = 11.35ANVYY332 pKa = 9.79GSNADD337 pKa = 3.77YY338 pKa = 11.51NSVTVTQNN346 pKa = 2.55
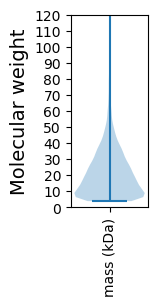
Molecular weight: 37.35 kDa
Isoelectric point according different methods:
Protein with the highest isoelectric point:
>tr|A0A090SKD9|A0A090SKD9_9VIBR Probable transmembrane protein OS=Vibrio variabilis OX=990271 GN=JCM19239_6793 PE=4 SV=1
MM1 pKa = 7.69SKK3 pKa = 8.98RR4 pKa = 11.84TFQPSVLKK12 pKa = 10.49RR13 pKa = 11.84KK14 pKa = 7.97RR15 pKa = 11.84THH17 pKa = 5.89GFRR20 pKa = 11.84ARR22 pKa = 11.84MATKK26 pKa = 10.44NGRR29 pKa = 11.84KK30 pKa = 9.39VINARR35 pKa = 11.84RR36 pKa = 11.84AKK38 pKa = 10.22GRR40 pKa = 11.84ARR42 pKa = 11.84LSKK45 pKa = 10.83
MM1 pKa = 7.69SKK3 pKa = 8.98RR4 pKa = 11.84TFQPSVLKK12 pKa = 10.49RR13 pKa = 11.84KK14 pKa = 7.97RR15 pKa = 11.84THH17 pKa = 5.89GFRR20 pKa = 11.84ARR22 pKa = 11.84MATKK26 pKa = 10.44NGRR29 pKa = 11.84KK30 pKa = 9.39VINARR35 pKa = 11.84RR36 pKa = 11.84AKK38 pKa = 10.22GRR40 pKa = 11.84ARR42 pKa = 11.84LSKK45 pKa = 10.83
Molecular weight: 5.25 kDa
Isoelectric point according different methods:
Peptides (in silico digests for buttom-up proteomics)
Below you can find in silico digests of the whole proteome with Trypsin, Chymotrypsin, Trypsin+LysC, LysN, ArgC proteases suitable for different mass spec machines.| Try ESI |
 |
|---|
| ChTry ESI |
 |
|---|
| ArgC ESI |
 |
|---|
| LysN ESI |
 |
|---|
| TryLysC ESI |
 |
|---|
| Try MALDI |
 |
|---|
| ChTry MALDI |
 |
|---|
| ArgC MALDI |
 |
|---|
| LysN MALDI |
 |
|---|
| TryLysC MALDI |
 |
|---|
| Try LTQ |
 |
|---|
| ChTry LTQ |
 |
|---|
| ArgC LTQ |
 |
|---|
| LysN LTQ |
 |
|---|
| TryLysC LTQ |
 |
|---|
| Try MSlow |
 |
|---|
| ChTry MSlow |
 |
|---|
| ArgC MSlow |
 |
|---|
| LysN MSlow |
 |
|---|
| TryLysC MSlow |
 |
|---|
| Try MShigh |
 |
|---|
| ChTry MShigh |
 |
|---|
| ArgC MShigh |
 |
|---|
| LysN MShigh |
 |
|---|
| TryLysC MShigh |
 |
|---|
General Statistics
Number of major isoforms |
Number of additional isoforms |
Number of all proteins |
Number of amino acids |
Min. Seq. Length |
Max. Seq. Length |
Avg. Seq. Length |
Avg. Mol. Weight |
|---|---|---|---|---|---|---|---|
0 |
1574166 |
37 |
2388 |
198.2 |
22.01 |
Amino acid frequency
Ala |
Cys |
Asp |
Glu |
Phe |
Gly |
His |
Ile |
Lys |
Leu |
|---|---|---|---|---|---|---|---|---|---|
8.566 ± 0.037 | 1.044 ± 0.012 |
5.568 ± 0.034 | 6.363 ± 0.03 |
4.129 ± 0.023 | 6.897 ± 0.031 |
2.191 ± 0.016 | 6.165 ± 0.027 |
5.157 ± 0.023 | 10.108 ± 0.037 |
Met |
Asn |
Gln |
Pro |
Arg |
Ser |
Thr |
Val |
Trp |
Tyr |
|---|---|---|---|---|---|---|---|---|---|
2.915 ± 0.018 | 4.152 ± 0.02 |
3.834 ± 0.019 | 4.301 ± 0.024 |
4.517 ± 0.026 | 6.884 ± 0.028 |
5.599 ± 0.023 | 7.257 ± 0.028 |
1.292 ± 0.015 | 3.062 ± 0.016 |
Most of the basic statistics you can see at this page can be downloaded from this CSV file
Proteome-pI is available under Creative Commons Attribution-NoDerivs license, for more details see here
| Reference: Kozlowski LP. Proteome-pI 2.0: Proteome Isoelectric Point Database Update. Nucleic Acids Res. 2021, doi: 10.1093/nar/gkab944 | Contact: Lukasz P. Kozlowski |
